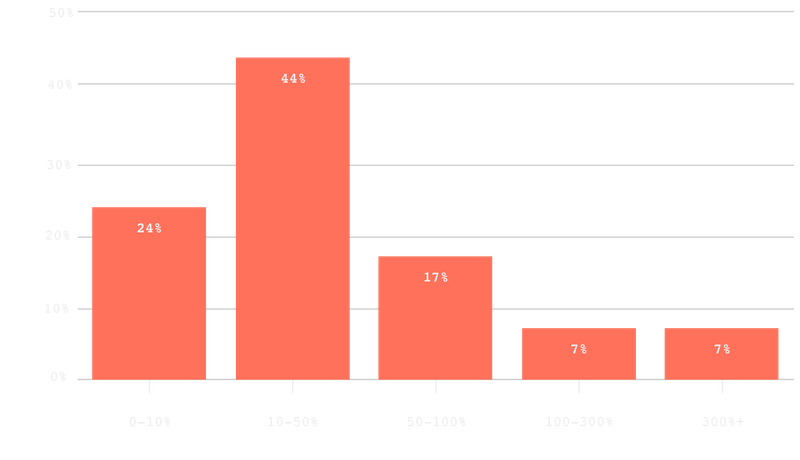
Which best describes your average year over year growth rate over the past 12 months?
Compared to 2023, growth rates appear to be accelerating again (yay!). There's little difference in companies growing by 10-100%, but there are less companies growing by 0-10% and more companies growing by 100%+.
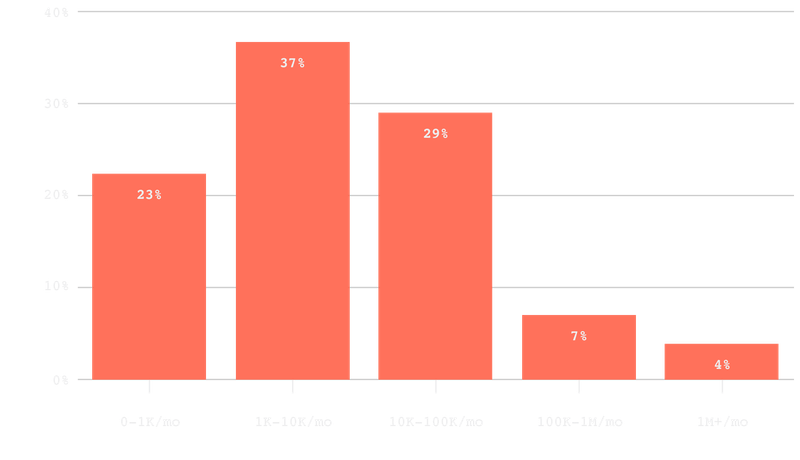
Which best describes your average website traffic of unique visitors over the past 3 months?
B2B is still all about quality, not quantity. Compared to 2023, there's an increase in traffic, but this could also be explained by the increase in more mature companies represented in this survey.
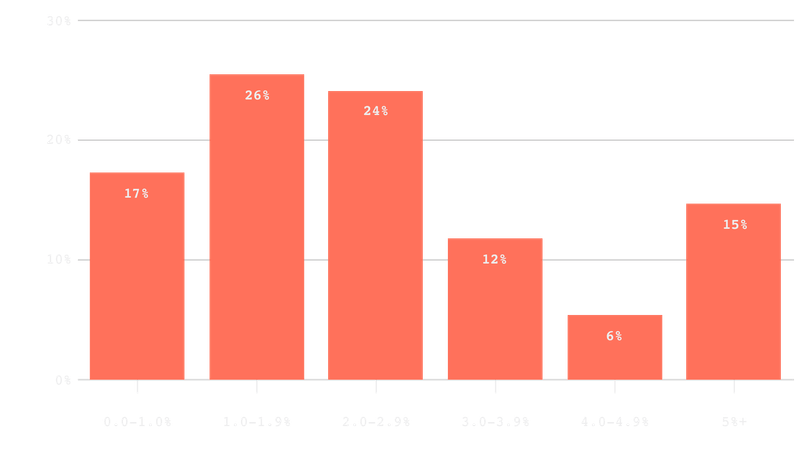
Which best describes your visitor to lead rate?
This data is especially useful for those of us working on conversion rate optimization. ~67% are converting less than 3% of website visitors into leads, which serves as a nice benchmark to compare against your own analytics when deciding how much effort to put into CRO efforts.
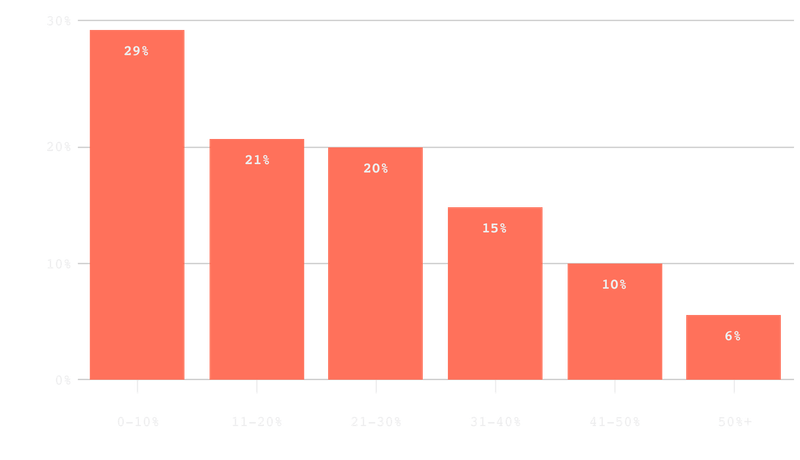
Which best describes your lead to customer rate?
Compared to 2023, there's a pretty large increase in conversion rates across the board. This could be a result of more comparison shopping, more switching, or AI making products more compelling (or none of those!).
Which best describes your total blended payback period?
Compared to 2023, payback periods are trending down, which is a good sign that perhaps rising customer acquisition costs have finally leveled off a bit. 60% report payback periods between 3 and 8 months, which serves as a good benchmark for what's "normal."
