Which best describes your average year over year growth rate over the past 12 months?
Most companies are growing, but at a relatively modest pace, with nearly half reporting year-over-year growth under 10%. That said, a meaningful minority are seeing much faster momentum, with roughly one in four growing over 50% annually, highlighting the wide gap between steady, incremental growth and breakout performers in SaaS.

Which best describes your average website traffic of unique visitors over the past 3 months?
Website traffic skews heavily toward the lower end, with most companies seeing fewer than 10,000 monthly visitors. Higher-traffic sites do exist, but they’re the exception, reinforcing that for most B2B SaaS companies, growth is driven more by targeted, high-intent traffic than sheer volume.

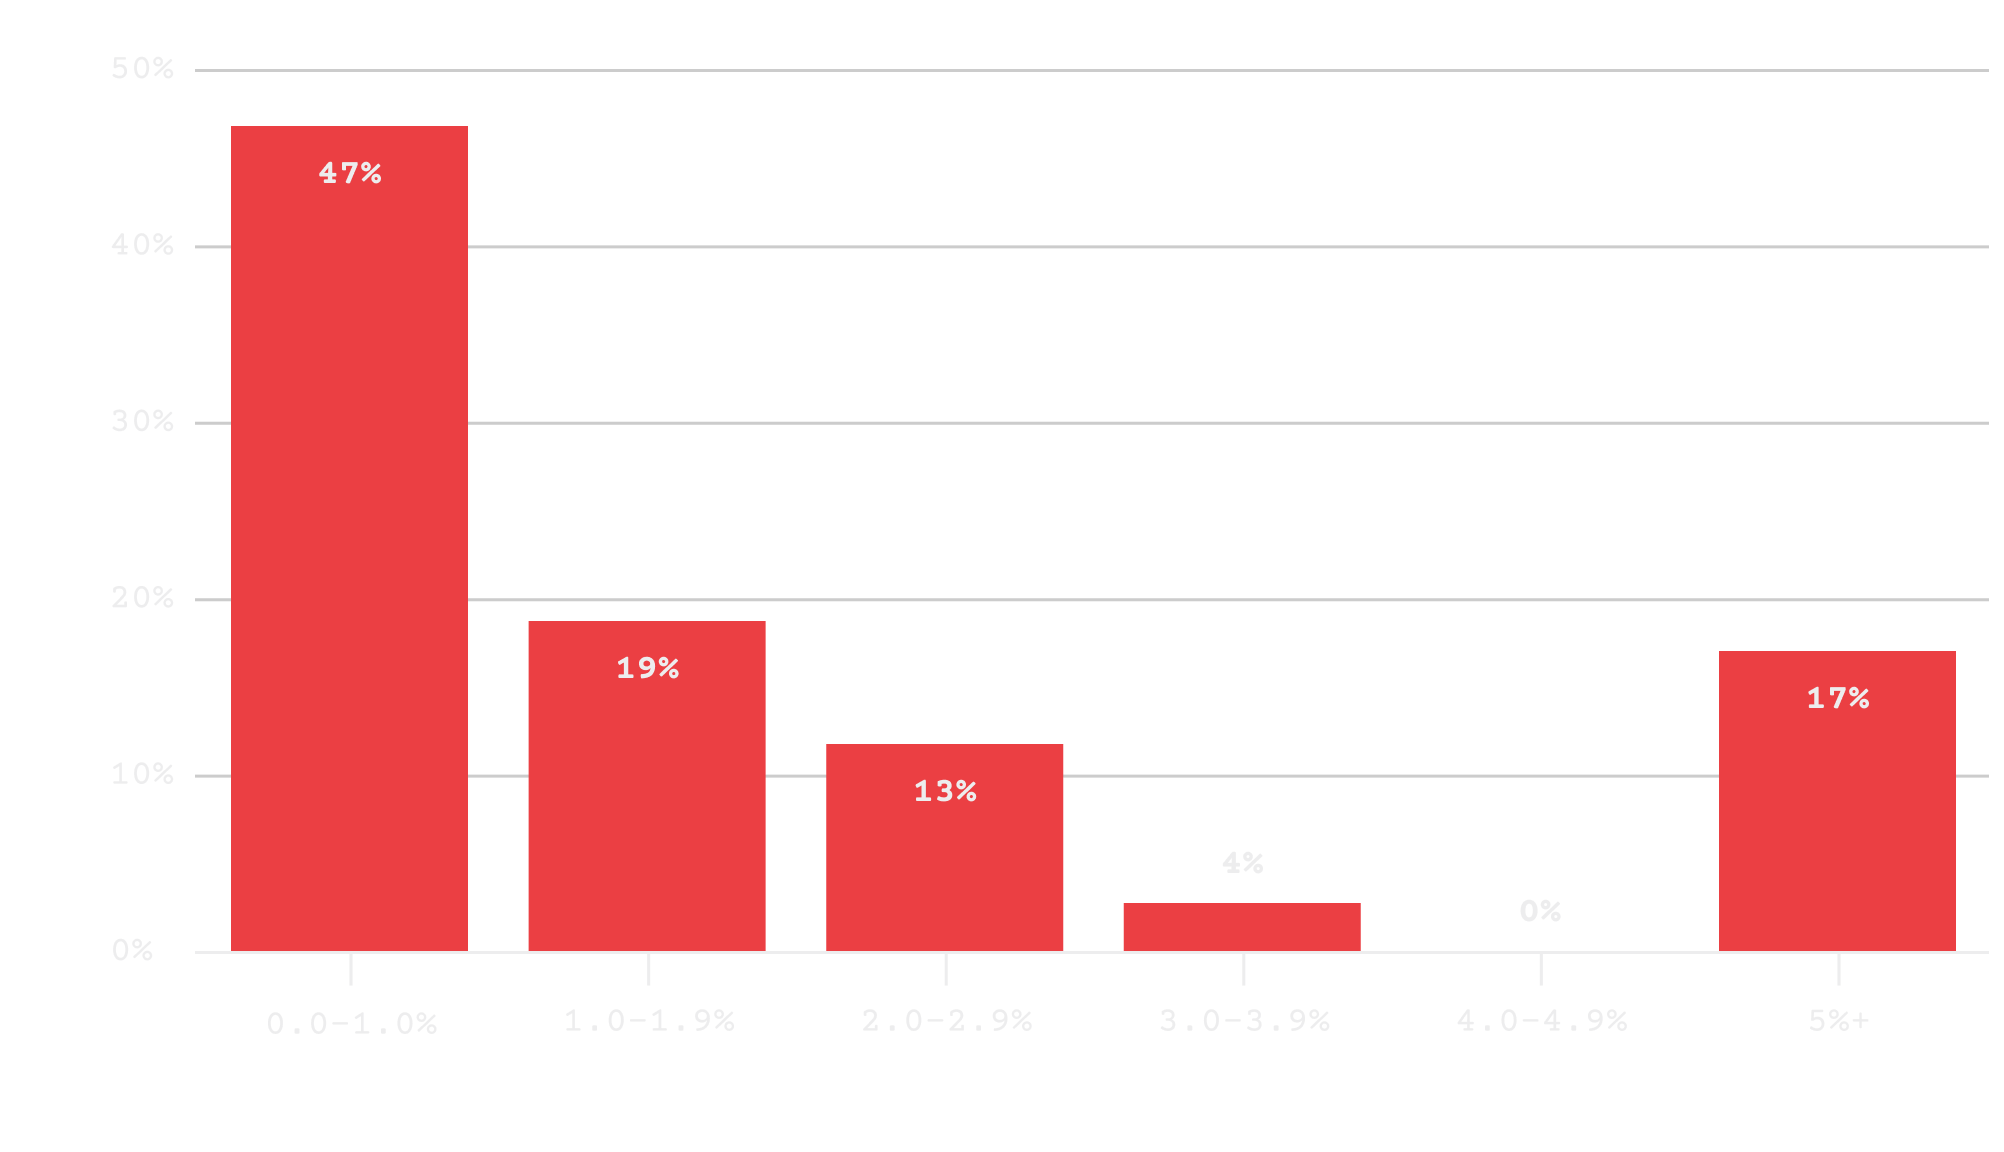
Which best describes your visitor to lead rate?
Most companies are converting a relatively small percentage of visitors into leads, with nearly half reporting conversion rates under 1%. That makes the 17% converting 5%+ particularly notable, highlighting a sharp divide between teams that have dialed in their conversion funnel and those still leaving significant upside on the table.
Which best describes your lead to customer rate?
Lead-to-customer conversion rates are more encouraging than top-of-funnel performance, with the majority converting at least 10% of leads into customers. Still, there’s a wide spread, and the meaningful share converting 30%+ shows just how impactful strong qualification, sales process, or product-led motion can be once leads are in the door.

Which best describes your total blended payback period?
Payback periods are relatively short in this sample, with nearly half of respondents recouping acquisition costs within two months — likely driven by the prevalence of lower-priced, PLG-oriented products. Even when extending the window, most still fall under six months, suggesting efficient go-to-market motions for the companies represented here.
