


0
0
Introduction

Hey 👋 I'm Corey, the founder of Swipe Files.
As a 4x first marketing hire and a marketer who's been at both bootstrapped and funded startups large and small, I've always wanted a way to benchmark against other SaaS companies to understand how I'm doing.
Unfortunately, that's been basically impossible...
Until now.
The State of SaaS Marketing is an annual report that aggregates data from hundreds of SaaS companies to build benchmarks on every major area of marketing.
Firmographics, target markets, team dynamics, pricing, growth, channels... it's the data I've always dreamed of having my hands on.
And now you can have it too.
Enjoy!

0
1
Foundational Data
Here’s some basic information about the survey respondents who provided the data in this report. This is mostly for context.
The nature of surveys like this is that it will always be biased to the nature of the pool of respondents you’re soliciting to complete the survey. In this case, it’s the lovely Swipe Files newsletter audience list.
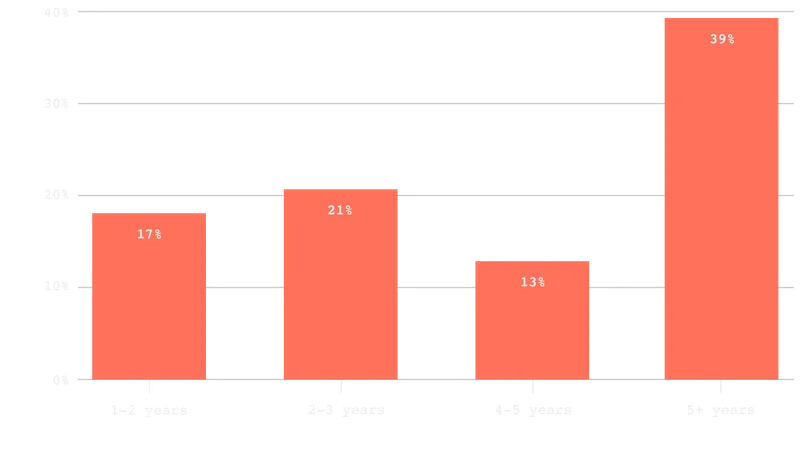
Which best describes the time your company has been in the market?
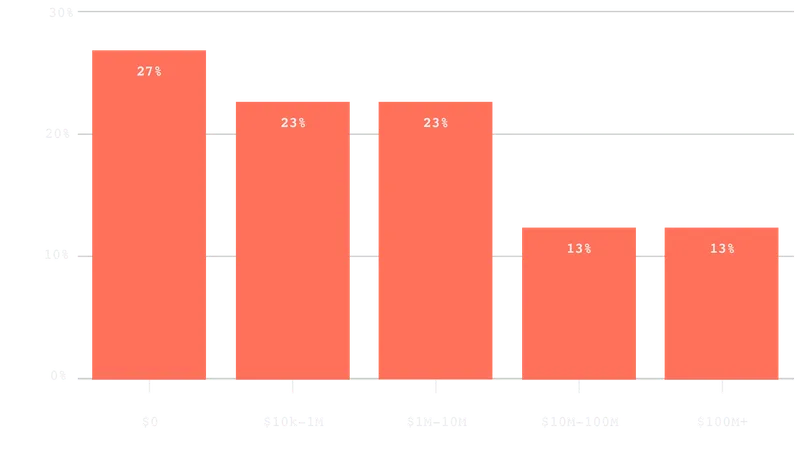
Which best describes the total capital raised at your company?
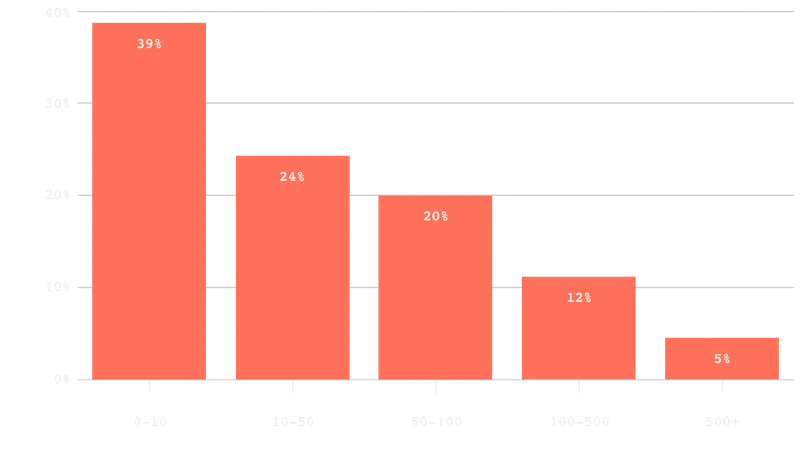
Which best describes the total employee count at your company?
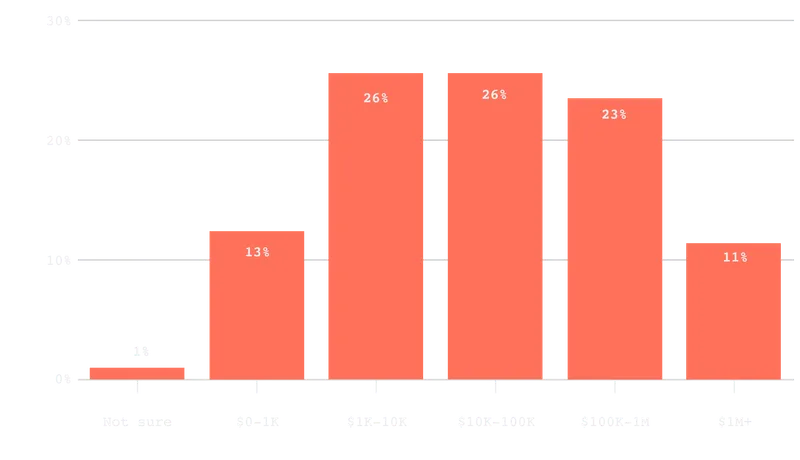
Which best describes your current MRR?
0
2
Target Market
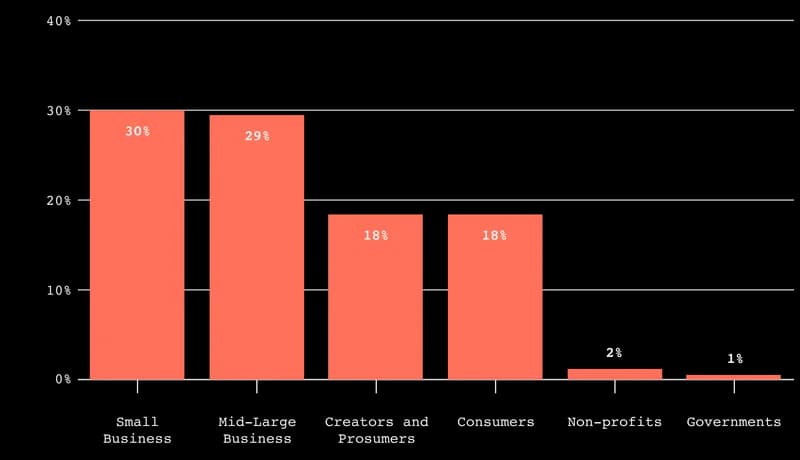
Which best represents your target customer?
No surprise that small businesses still dominate the customer profile, although the representation of all other segments are up for a much more even distribution compared to 2023.
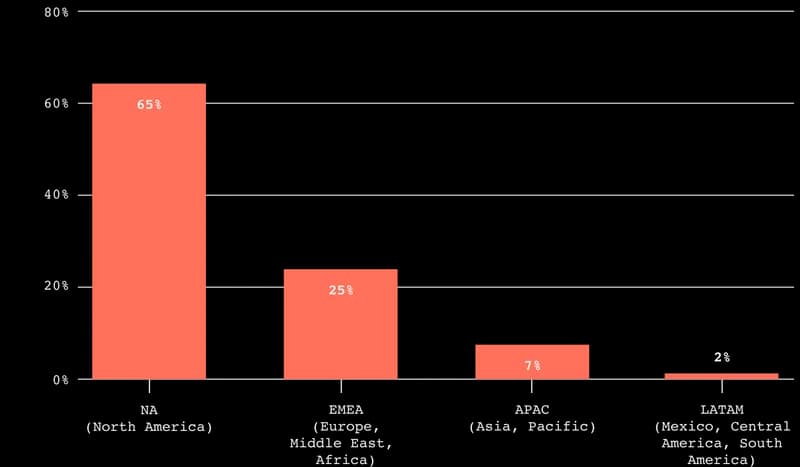
Which best describes your primary market?
North America is still the dominant market with little change compared to 2023, though the trend is definitely still inching toward a more globalized distribution. With the pricing parity of the US Dollar, many countries, but those in Europe especially, want to sell to the United States.
0
3
Marketing Team
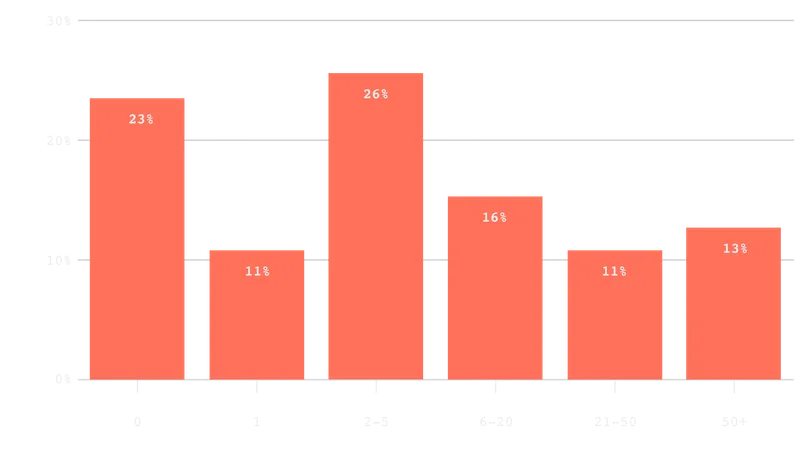
In addition to you, how many full-time or contract employees currently work in marketing?
Compared to 2023, we split out "1-5" into "1" and "2-5" to get more clarity on how many "marketing team of one's" were out there. Interestingly, it appears marketers are hired in pairs, or at least initially. Also of note is that compared to the previous year, we have more representation of larger marketing teams.
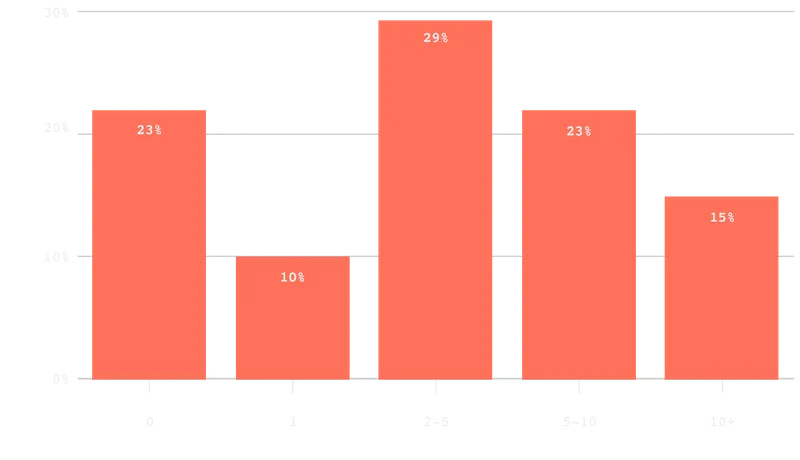
How many contractors or freelancers do you work with?
Compared to 2023, there's a huge increase in contract/freelance teams of 5+. This could be related to the previous question in that there's more representation of marketing teams in general, or it could also be indicative that marketing teams are trending away from full-time employees.
How many marketing agencies do you work with?
Compared to 2023, there's a notable increase in companies working with an agency. My suspicion is that respondents are a bit liberal with what qualifies as a marketing agency or have churned through a few different agencies who do the same thing.
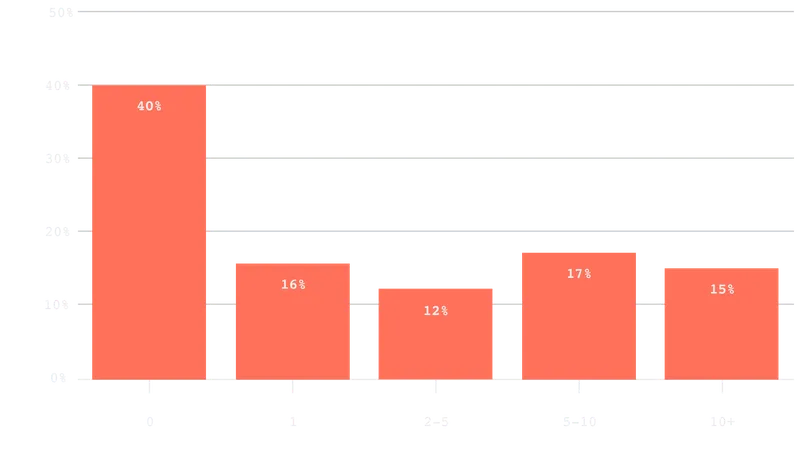
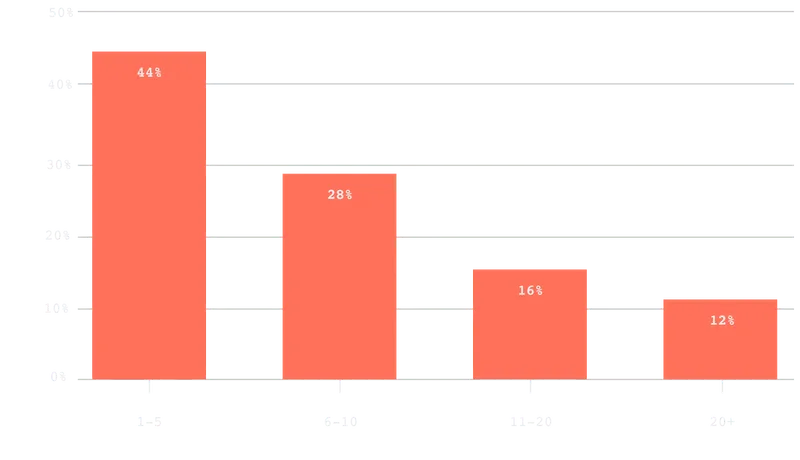
How many tools do you use across your marketing team?
Definitely a noticeable increase in the number of tools marketers use compared to the previous years. With how ubiquitous AI is in every tool and how many tools have popped up because of AI, this is not surprising.
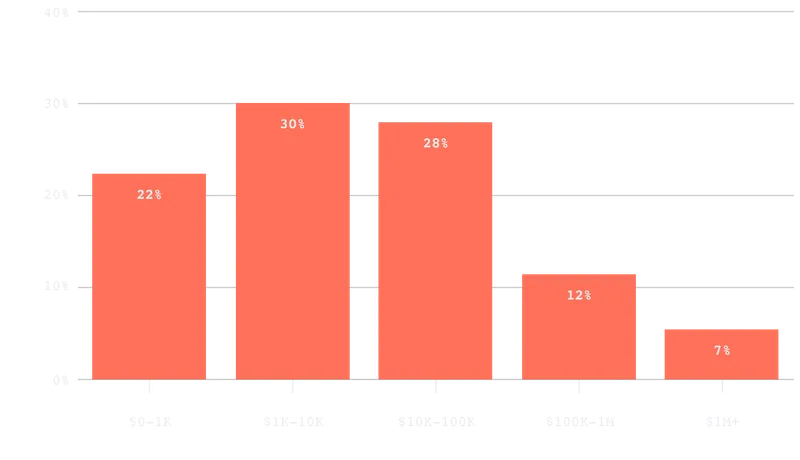
Which best describes your annual spending on marketing tools?
These numbers are very close to the 2023 results. Still, the number spending $100k+ have doubled.
0
4
Revenue and Pricing
Which best describes your monthly Average Revenue Per Customer?
These numbers coincide with the responses about the target customer, with small businesses being the largest portion and mid-large businesses being the second largest portion. Though there is still a noticeable increase in ARPC $1k+.
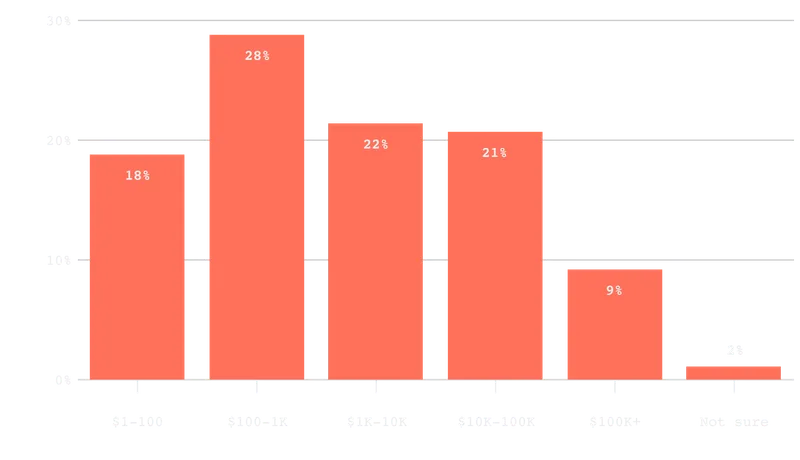
Which best describes the pricing plan for your lowest-cost pricing tier on a monthly basis?
Compared to 2023, there's a more balanced distribution across the pricing spectrum. With the discrepancy between the number of companies who's ARPC is $100+ and the number of companies who's starting price is $100+, this tells us there's healthy expansion revenue and path up the value ladder.
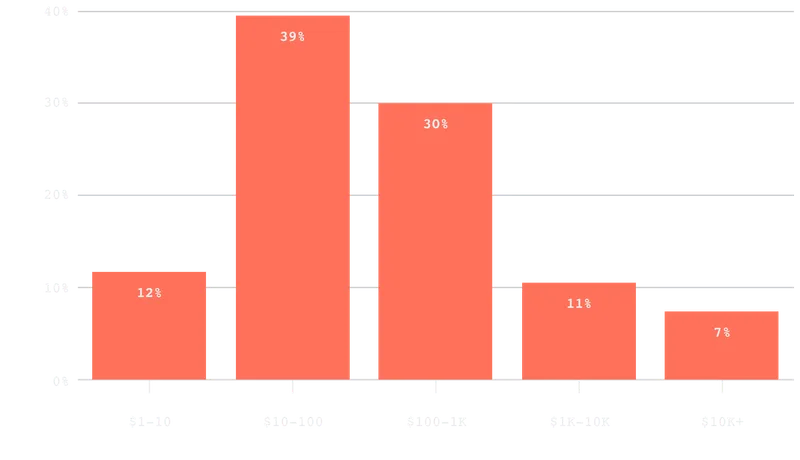
Which best describes the pricing plan for your highest-cost pricing tier on a monthly basis?
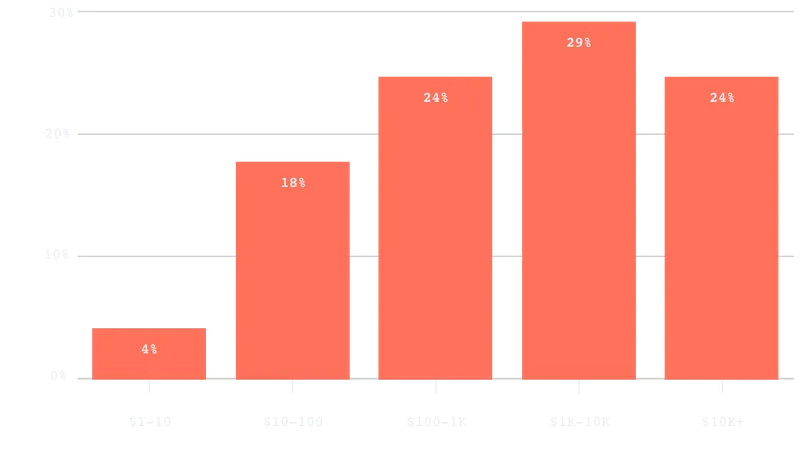
This data highlights the range in SaaS. Most offer a plan under $100/mo and also a plan over $1,000/mo. Compared to 2023, there's a large increase in plans $10,000+.
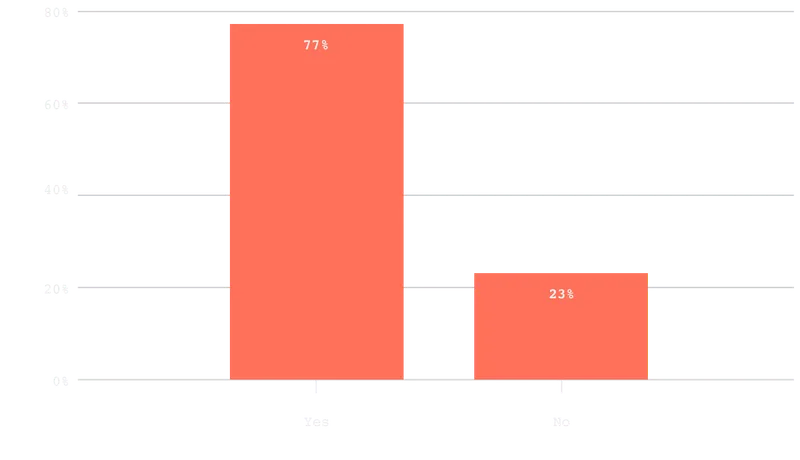
Do you offer a free trial for your product?
The vast majority do, and compared to 2023, there's a large increase in the last year. Why? Possibly due to increased competition and AI making a "try before you buy" model more enticing.
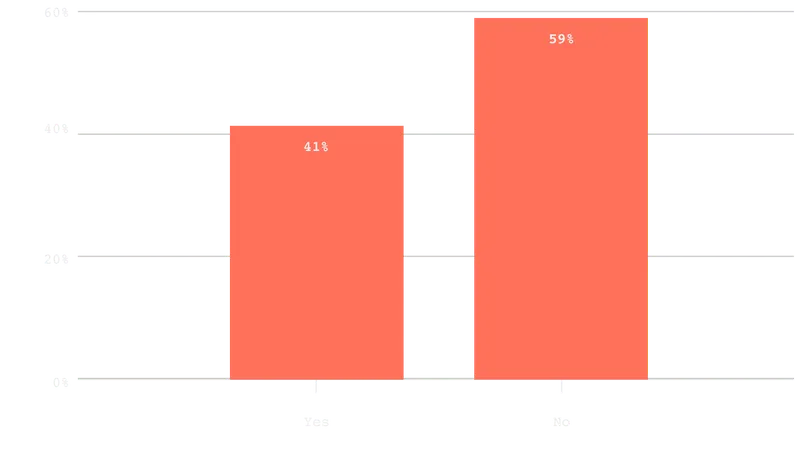
Do you offer a forever-free plan?
Compared to 2023, there's a substantial increase in companies offering a forever-free plan. I suspect this also may be due to AI, where usage-based pricing models have been incorporated en masse and offer a great way to turn free users into paid customers.
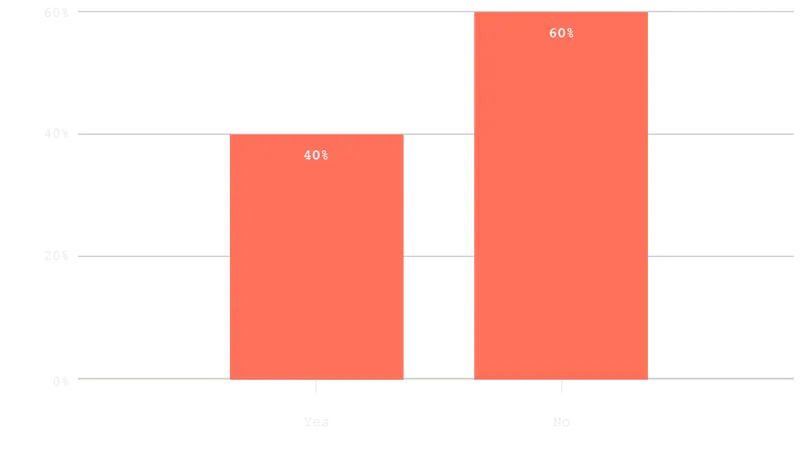
Do you charge a setup fee?
The number of companies charging a setup fee is more than double what it was in 2023. This could coincide with a trend of offering more "Software + Services" pricing plans.
0
5
Growth Metrics
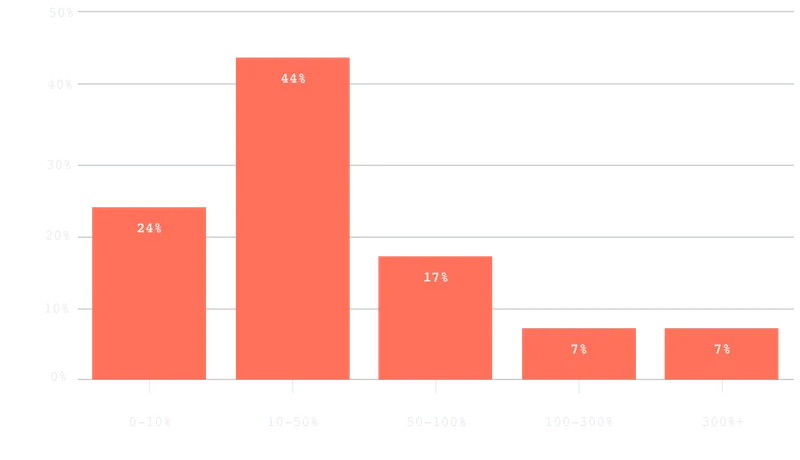
Which best describes your average year over year growth rate over the past 12 months?
Compared to 2023, growth rates appear to be accelerating again (yay!). There's little difference in companies growing by 10-100%, but there are less companies growing by 0-10% and more companies growing by 100%+.
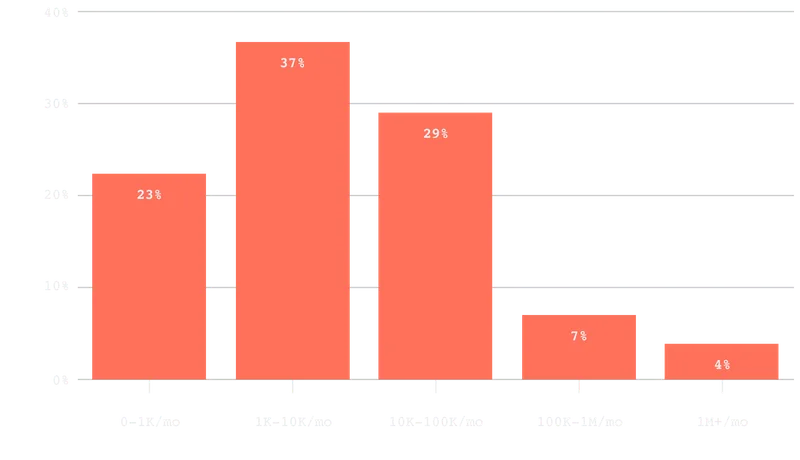
Which best describes your average website traffic of unique visitors over the past 3 months?
B2B is still all about quality, not quantity. Compared to 2023, there's an increase in traffic, but this could also be explained by the increase in more mature companies represented in this survey.
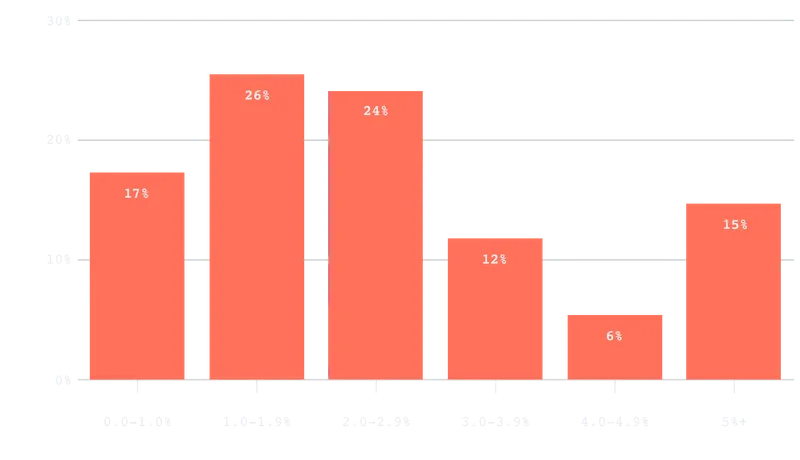
Which best describes your visitor to lead rate?
This data is especially useful for those of us working on conversion rate optimization. ~67% are converting less than 3% of website visitors into leads, which serves as a nice benchmark to compare against your own analytics when deciding how much effort to put into CRO efforts.
Which best describes your lead to customer rate?
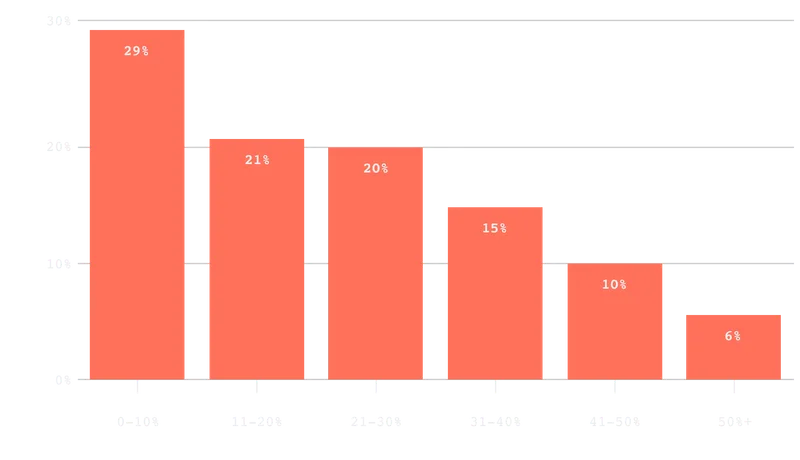
Compared to 2023, there's a pretty large increase in conversion rates across the board. This could be a result of more comparison shopping, more switching, or AI making products more compelling (or none of those!).
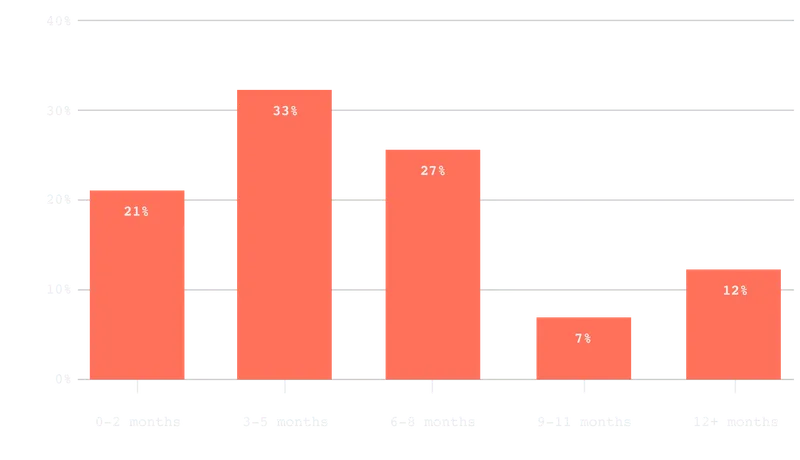
Which best describes your total blended payback period?
Compared to 2023, payback periods are trending down, which is a good sign that perhaps rising customer acquisition costs have finally leveled off a bit. 60% report payback periods between 3 and 8 months, which serves as a good benchmark for what's "normal."
0
6
Marketing Channels
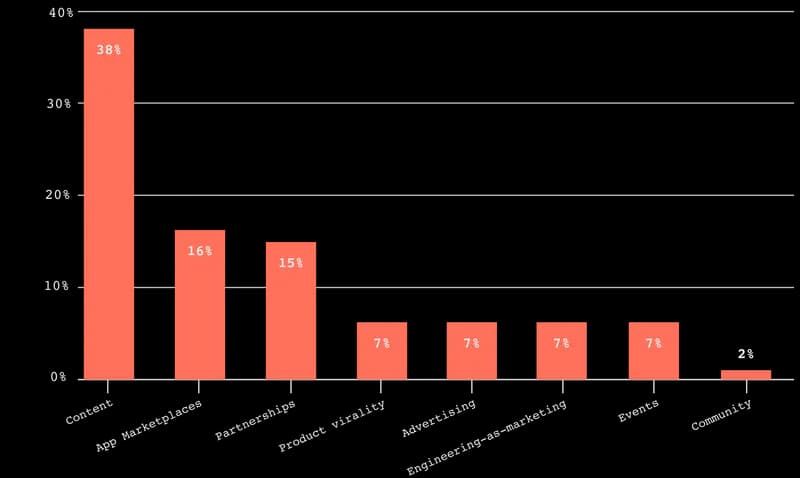
Which channel do you believe has the biggest impact on growing revenue?
Content is still king. A few that have moved up in popularity: app marketplaces, engineering-as-marketing, and events. The one that moved down in popularity the most: advertising.
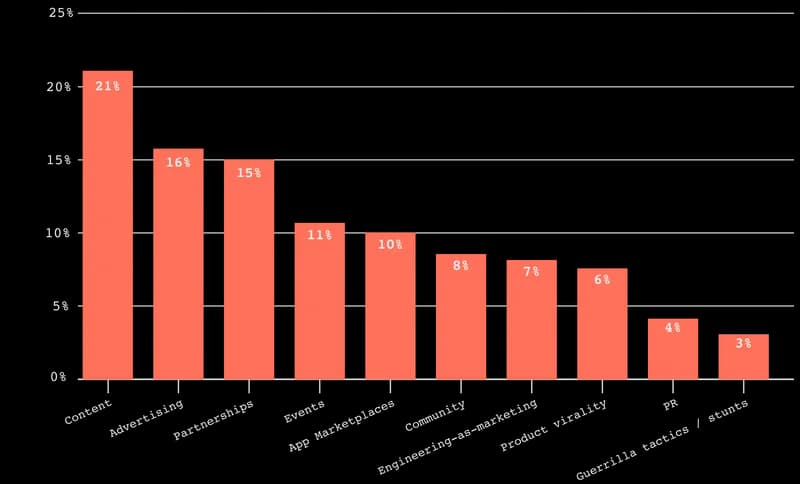
Which channels have you invested resources in the last 12 months?
There's a huge redistribution from content to all other channels compared to 2023. It's possible that 2023 respondents were over-indexed on content, or it's possible that it's a more macro-shift that's happened in the last year.
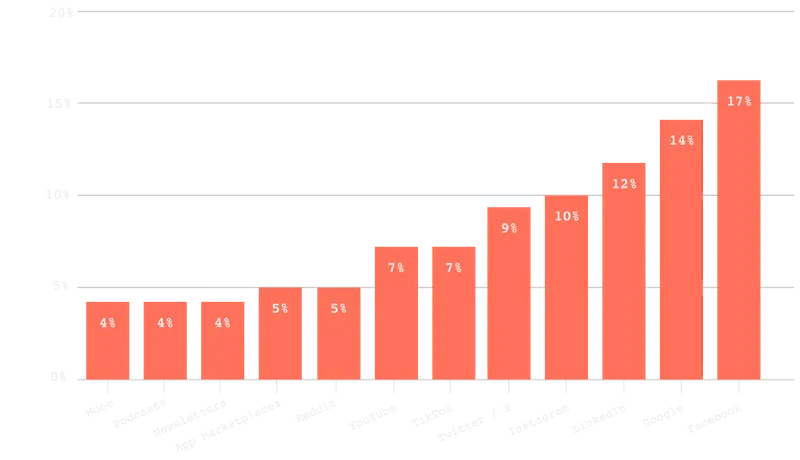
Which channels have your company advertised on in the last 12 months?
Compared to 2023, there's a much more even distribution across advertising channels. Given the answer about marketing dollars invested in the last year, this is also not surprising.
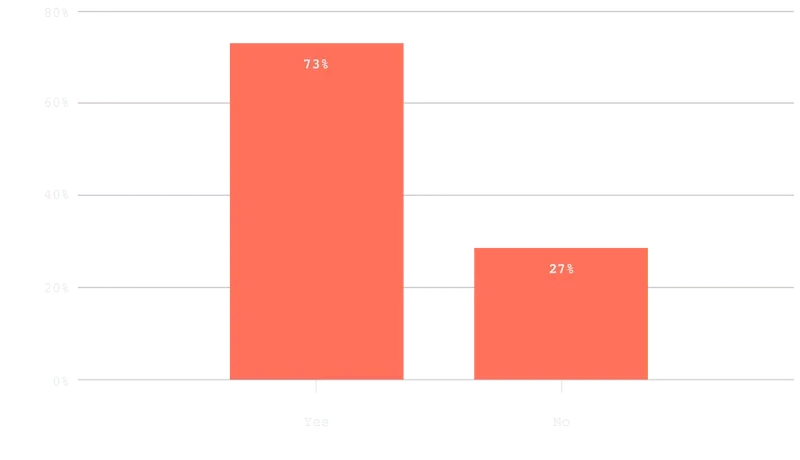
Does your company send an email newsletter?
Compared to 2023, the number of companies sending an email newsletter has gone up by 20%.
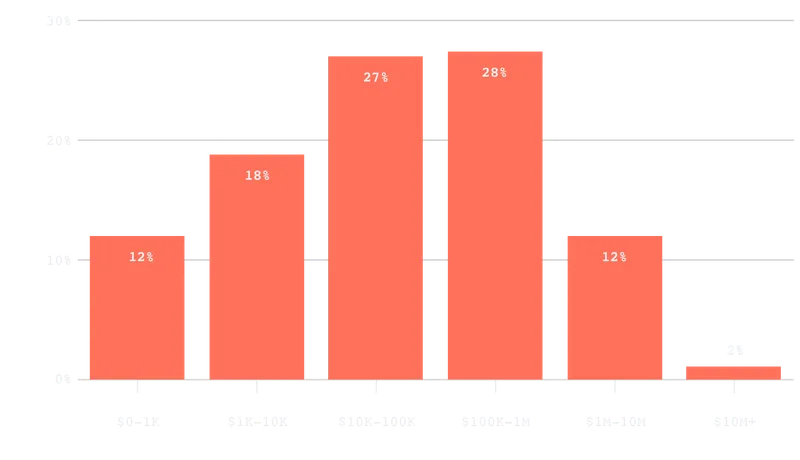
Which best describes how much money you have invested in marketing in the last 12 months, including salaries?
There’s a wide spread of results across the board. This question in particular is going to depend on revenue, funding, and time in market. So it’s not a great standalone analysis. Regardless, interesting to compare against budgets.
A thank you to just a few of our survey respondents



Swipe the best SaaS homepages
Grab our hand-picked collection of homepages proven to convert.