


0
0
Introduction

Hey 👋 I'm Corey, the founder of Swipe Files.
As a 4x first marketing hire and a marketer who's been at both bootstrapped and funded startups large and small, I've always wanted a way to benchmark against other SaaS companies to understand how I'm doing.
Unfortunately, that's been basically impossible...
Until now.
The State of SaaS Marketing is an annual report that aggregates data from hundreds of SaaS companies to build benchmarks on every major area of marketing.
Firmographics, target markets, team dynamics, pricing, growth, channels... it's the data I've always dreamed of having my hands on.
And now you can have it too.
Enjoy!

0
1
Foundational Data
Here’s some basic information about the survey respondents who provided the data in this report. This is mostly for context.
The nature of surveys like this is that it will always be biased to the nature of the pool of respondents you’re soliciting to complete the survey. In this case, it’s the lovely Swipe Files newsletter audience list.
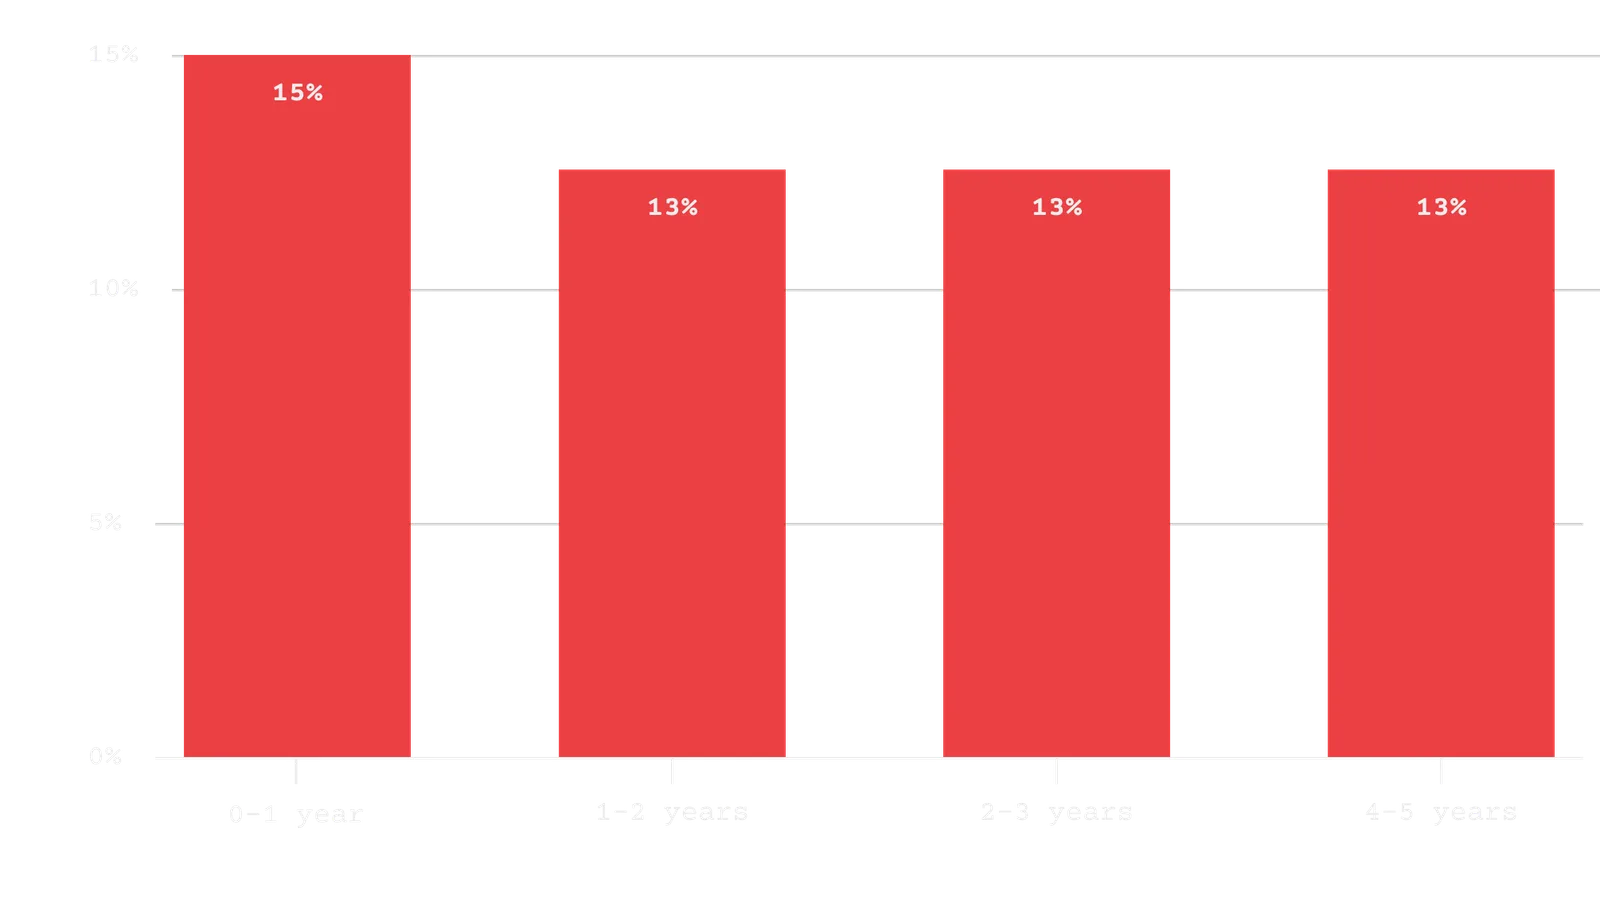
Which best describes the time your company has been in the market?
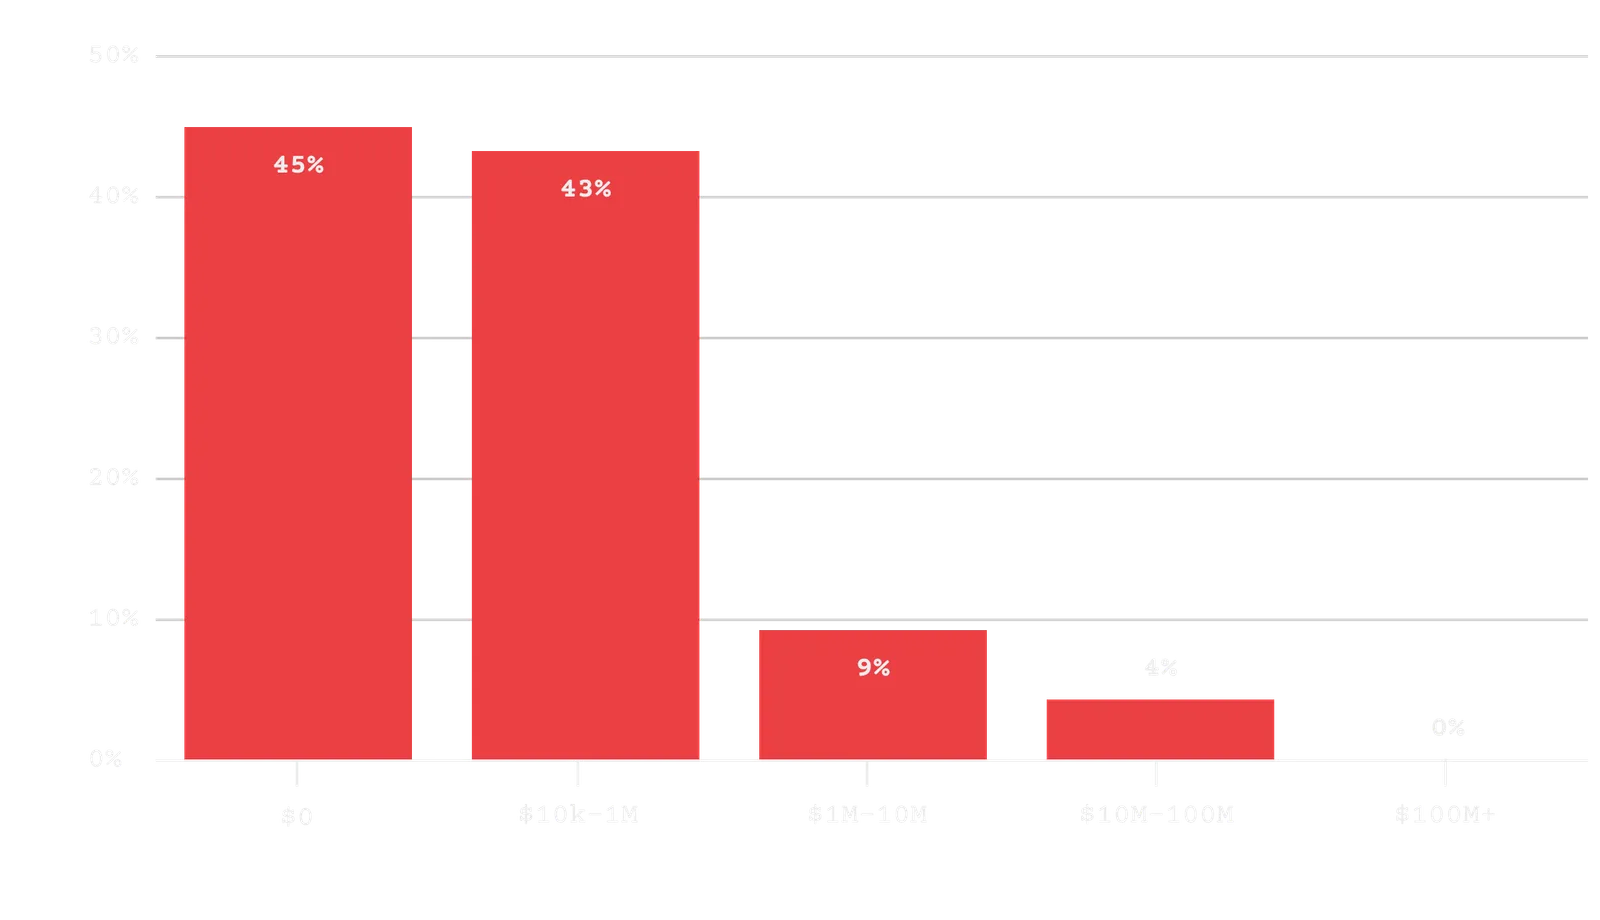
Which best describes the total capital raised at your company?
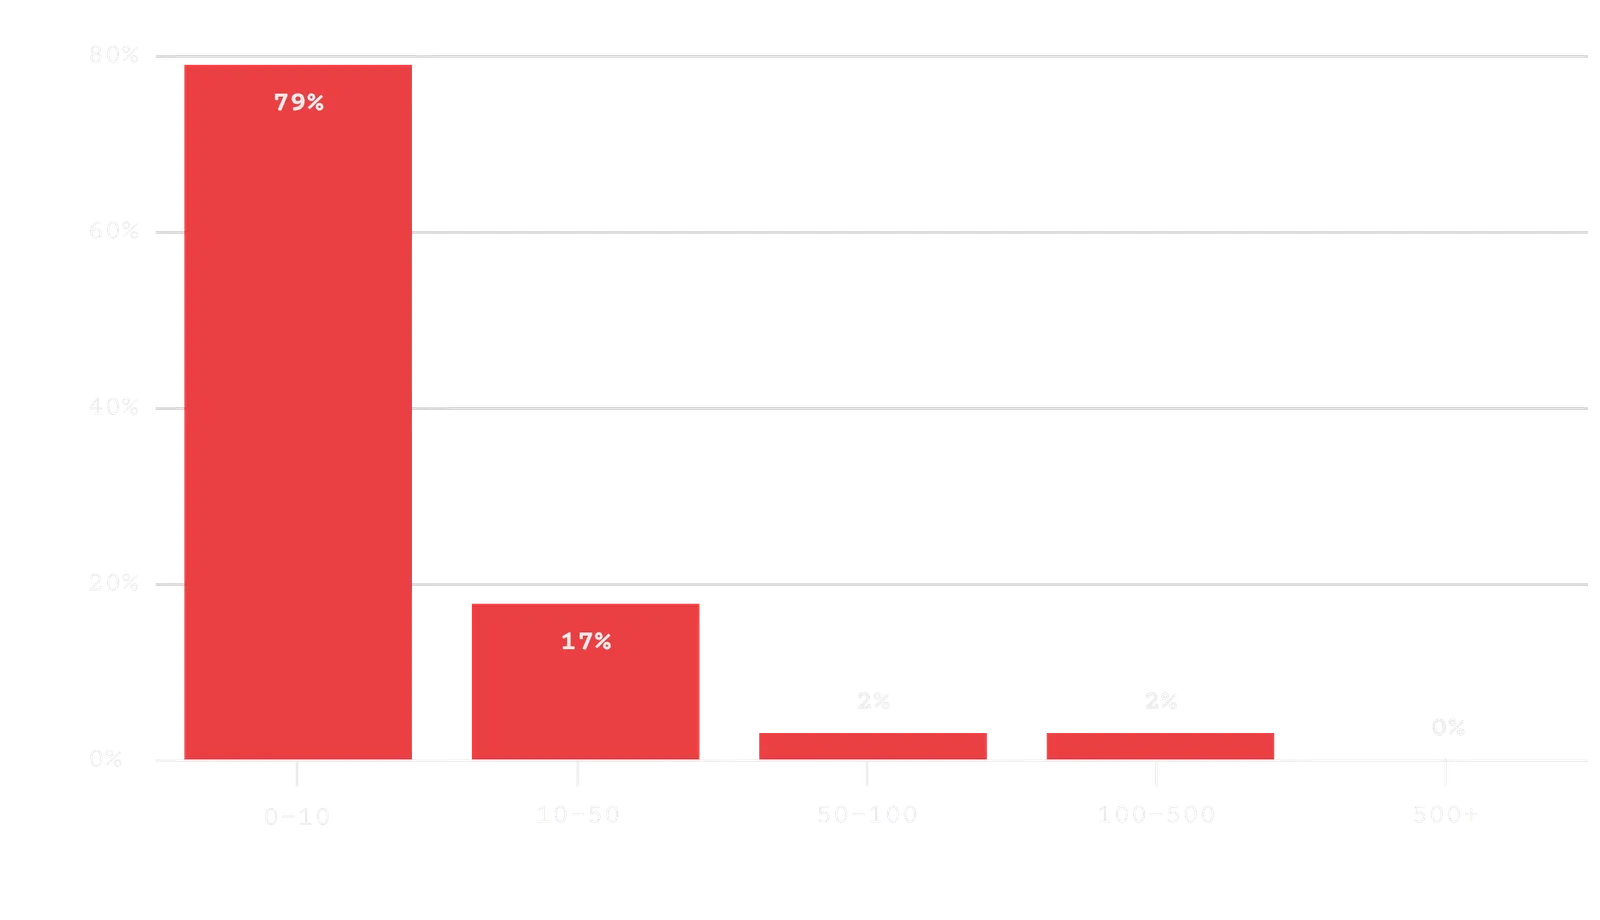
Which best describes the total employee count at your company?
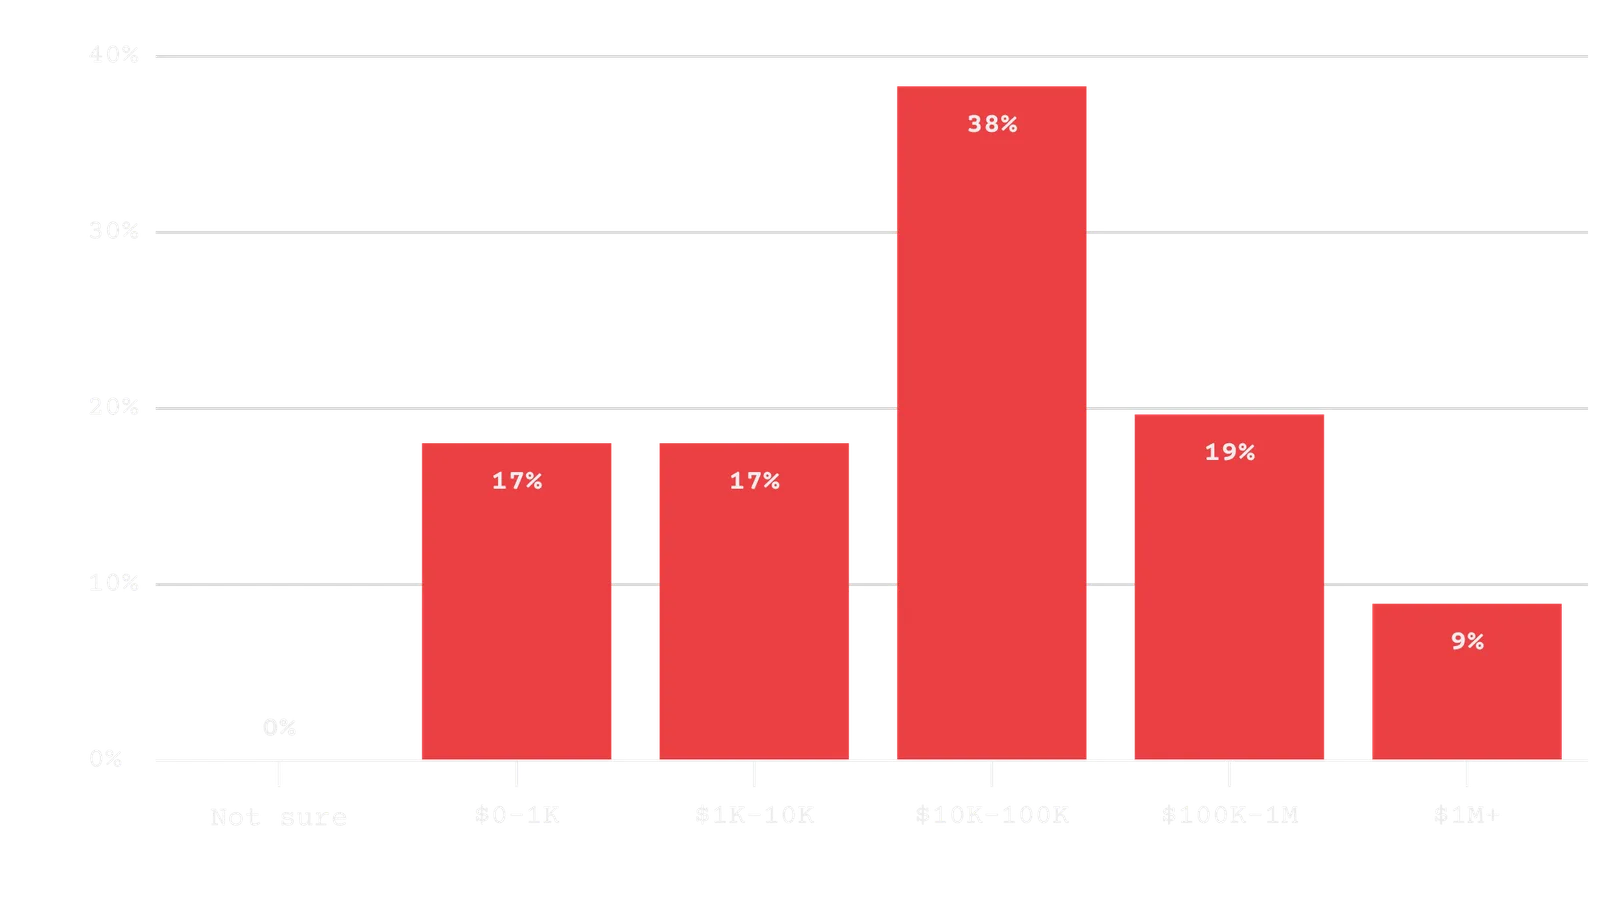
Which best describes your current MRR?
0
2
Target Market
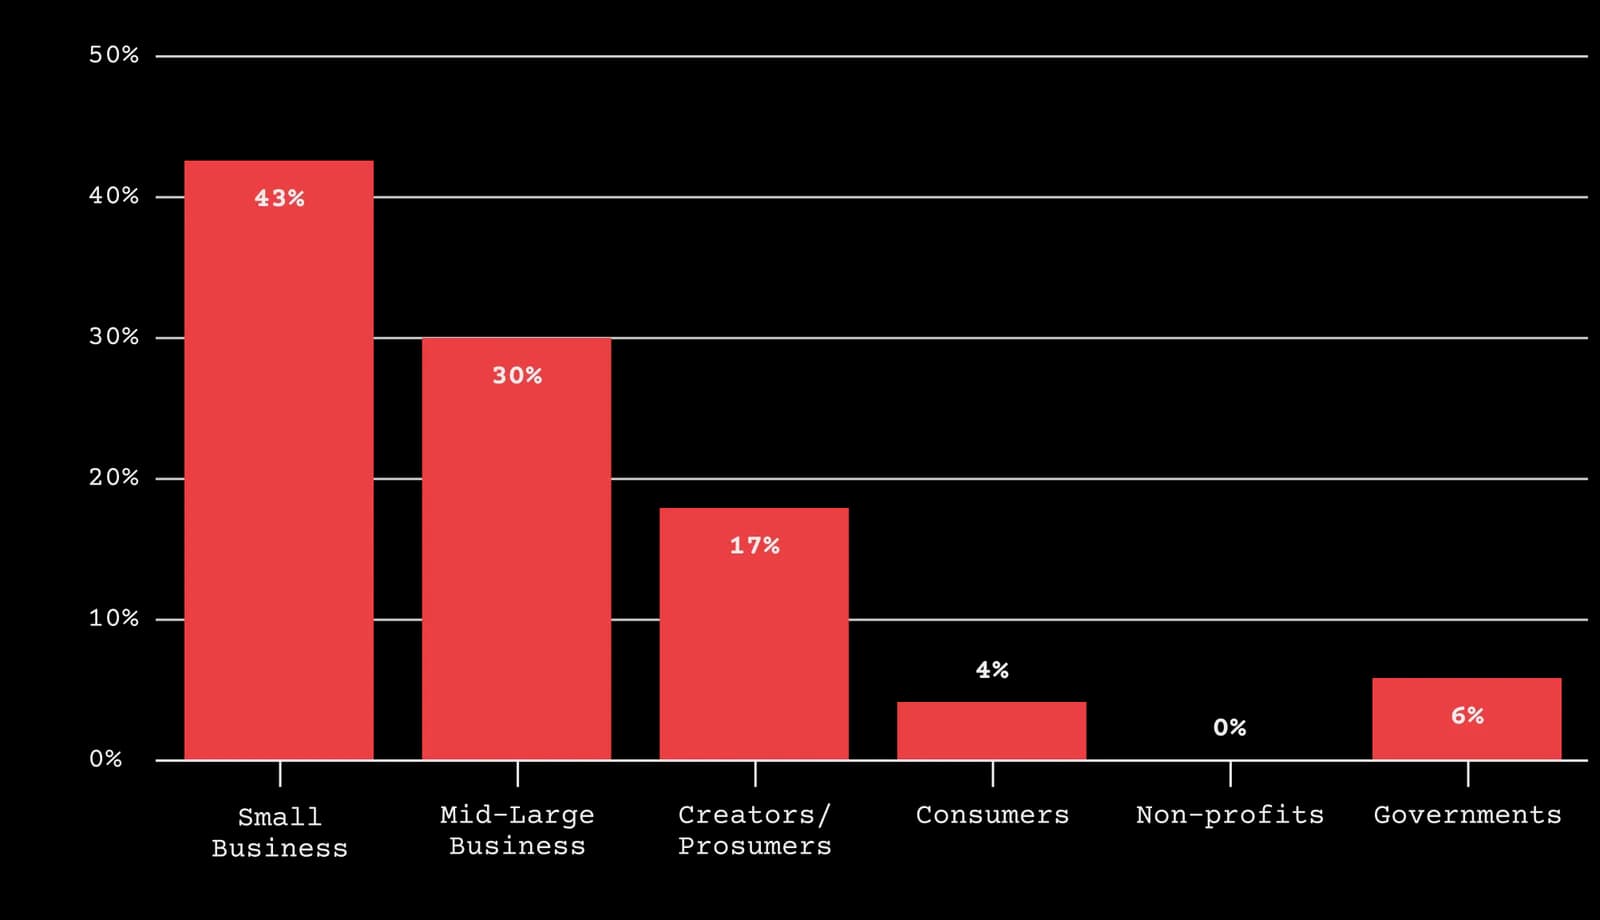
Which best represents your target customer?
Small businesses remain the dominant target customer by a wide margin, with mid-large businesses firmly in second place. Together, these two segments make up the clear majority of respondents, reinforcing that most SaaS companies are still focused on selling to organizations rather than individuals. Creators and prosumers represent a meaningful minority, while consumers, governments, and presumably nonprofits remain niche targets.
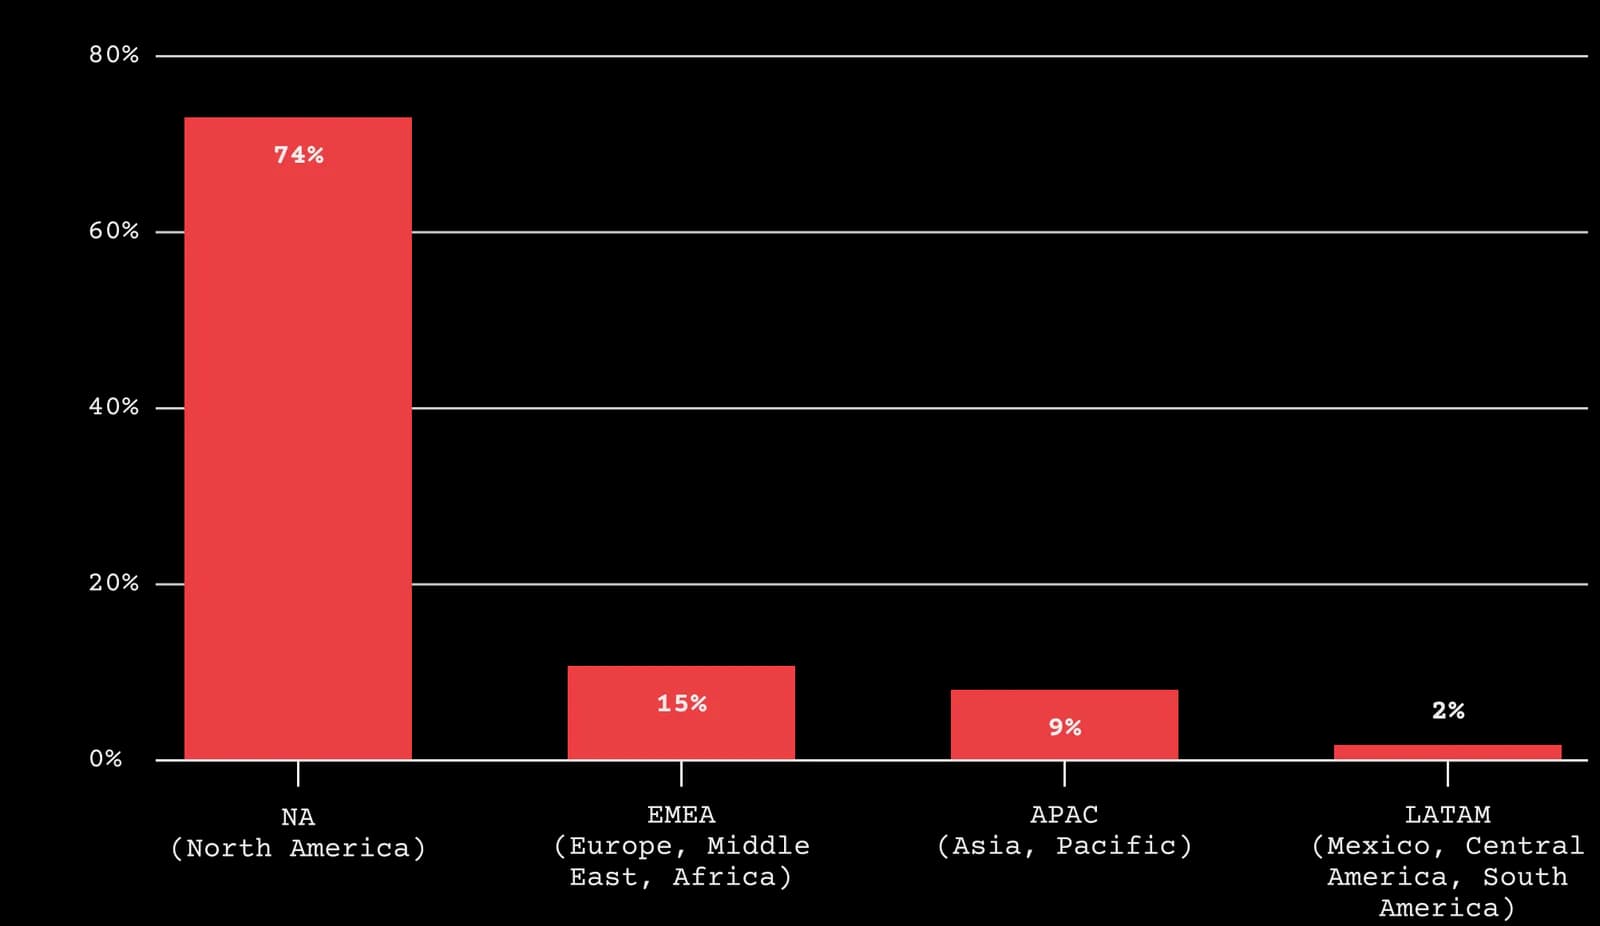
Which best describes your primary market?
North America continues to dominate as the primary market by a wide margin, with nearly three-quarters of respondents focused there. EMEA and APAC together account for a meaningful minority, pointing to a steadily globalizing SaaS landscape, while LATAM remains a smaller but emerging market.
0
3
Marketing Team
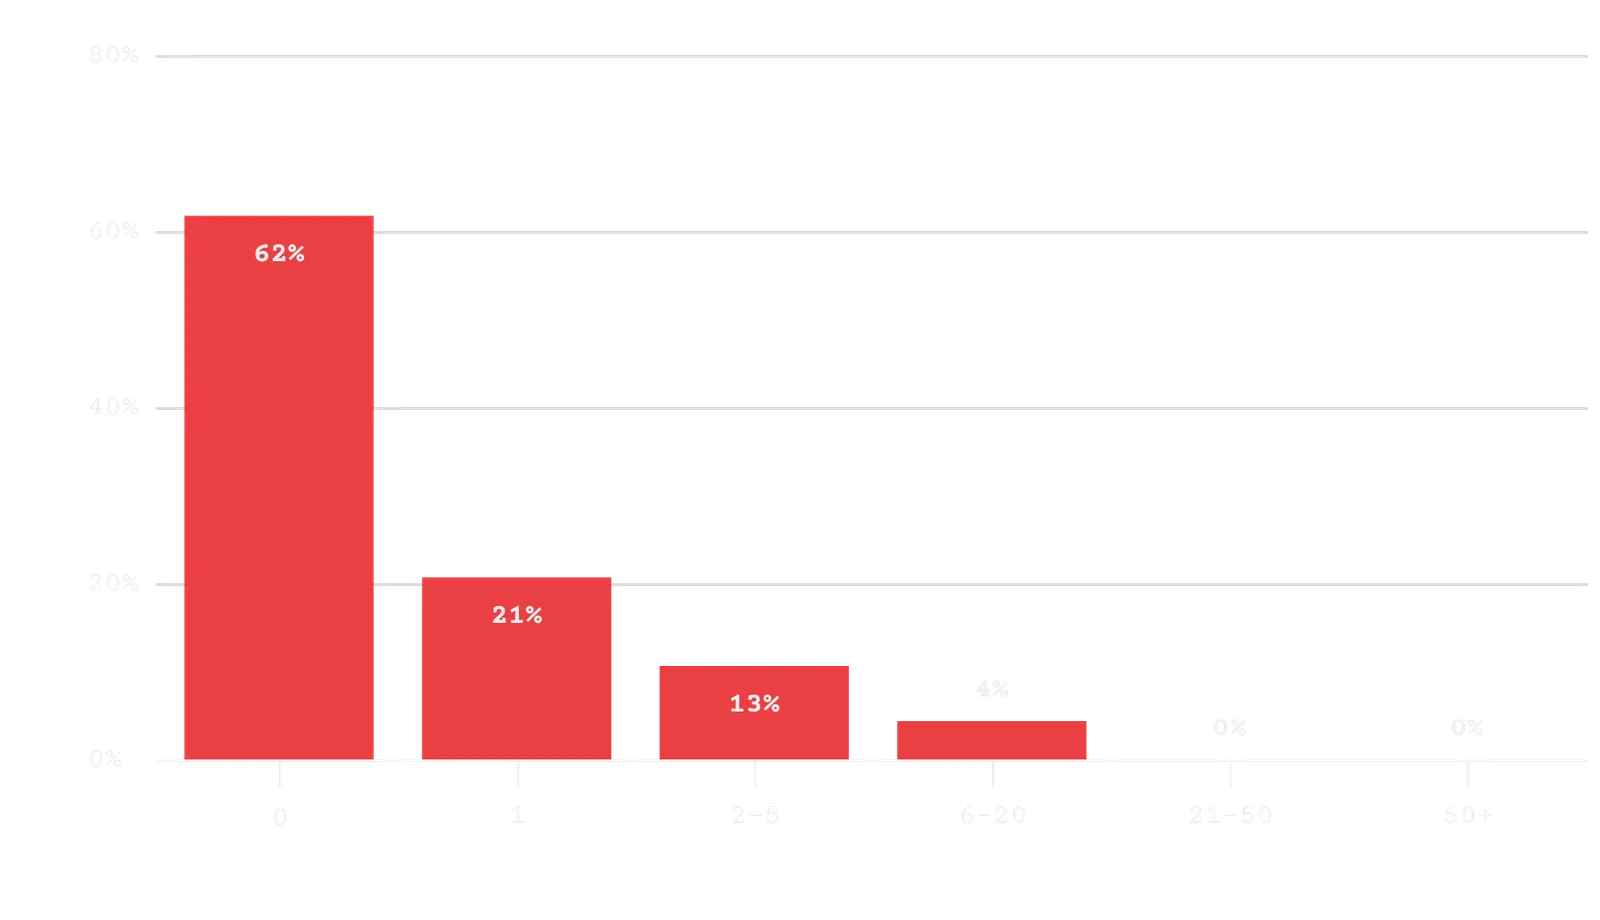
In addition to you, how many full-time or contract employees currently work in marketing?
The “marketing team of one” is still the norm, with the majority of respondents reporting no additional marketing support beyond themselves. A meaningful portion have added a single hire or a small team, but larger marketing teams remain rare, reinforcing how lean most SaaS marketing operations continue to be.
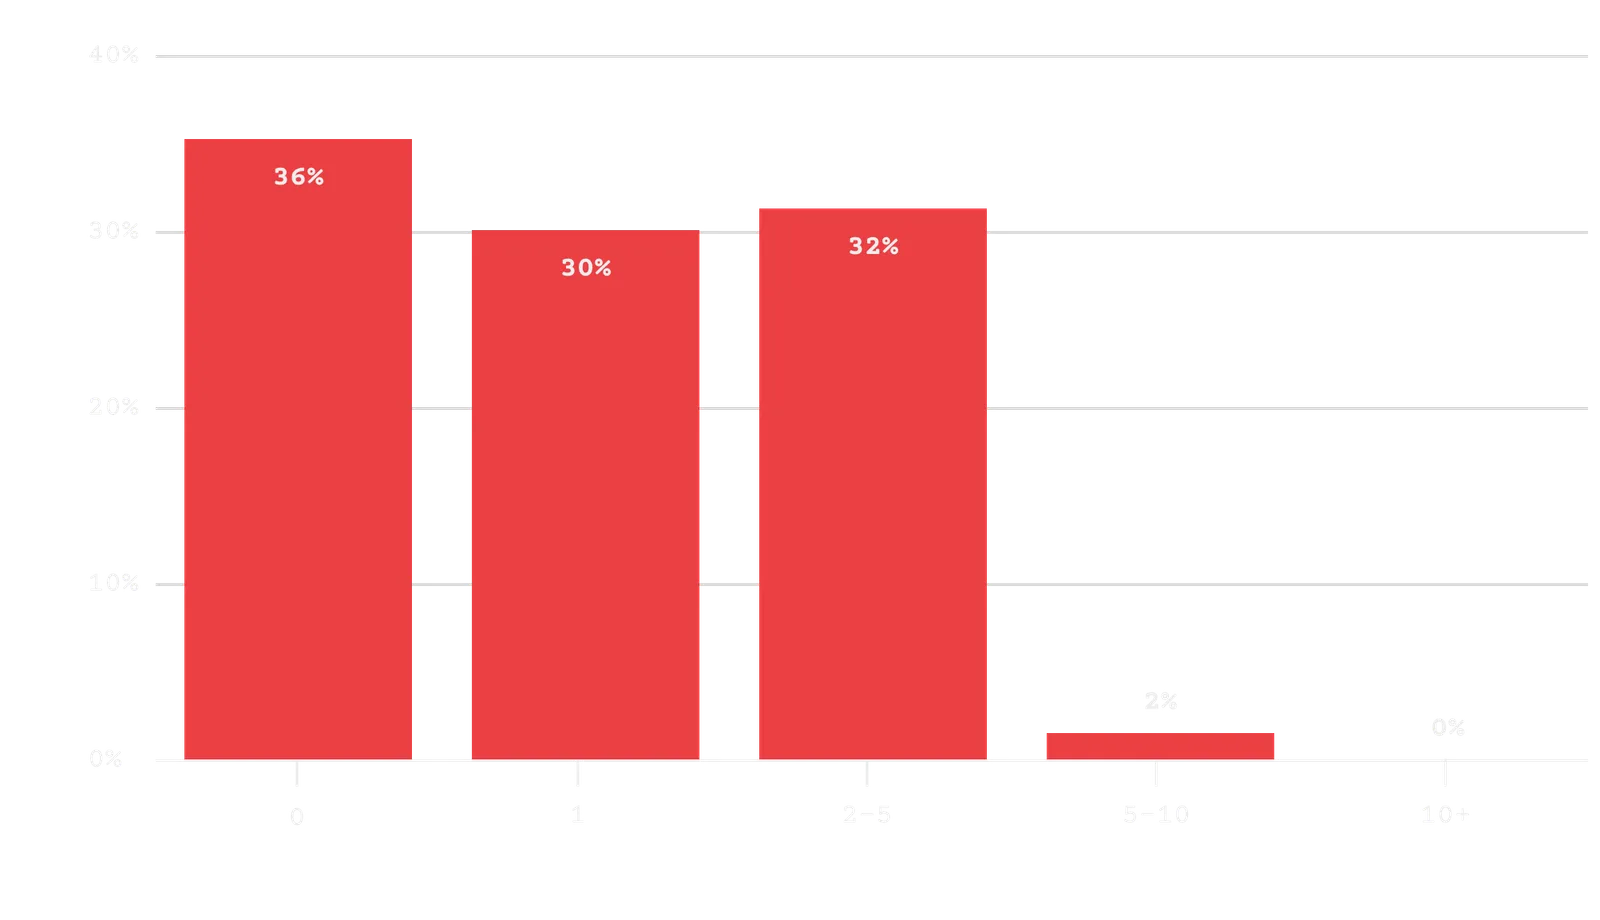
How many contractors or freelancers do you work with?
Most teams are supplementing in-house efforts with at least some contract help, with the largest share working with one or a small handful of freelancers. Very few are managing large contract teams, suggesting contractors are primarily used for targeted, specialized work rather than as a full replacement for an internal marketing team.
How many marketing agencies do you work with?
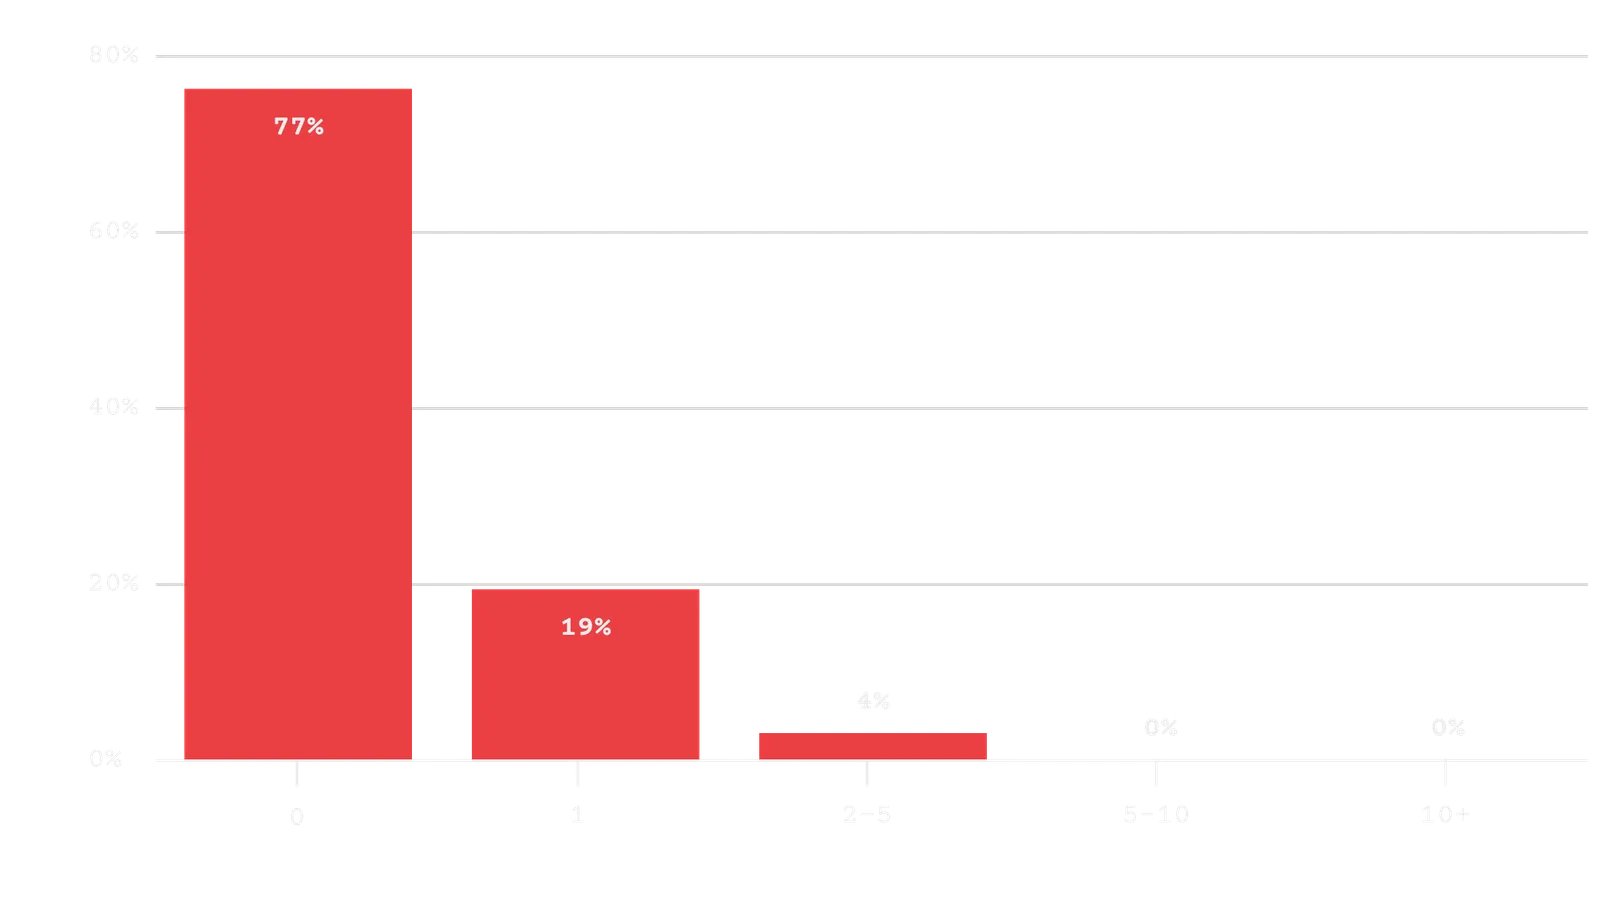
The vast majority of respondents aren’t working with any marketing agencies at all. For those that do, it’s typically a single agency rather than multiple partners, reinforcing a preference for keeping marketing execution in-house or tightly controlled rather than heavily outsourced.
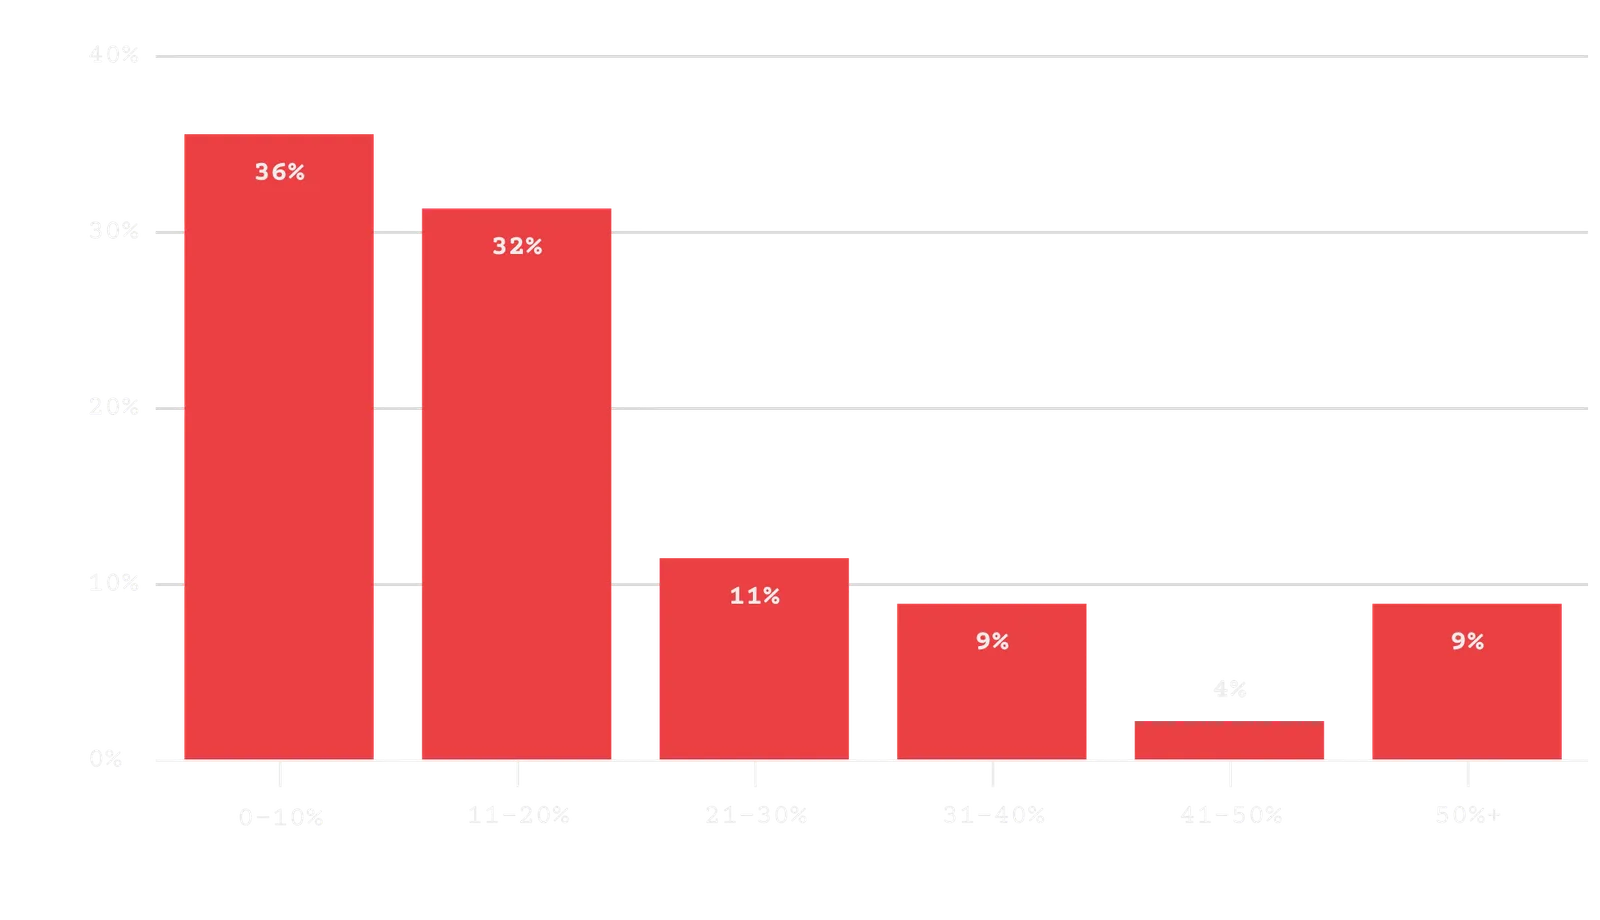
Which best describes your lead to customer rate?
Lead-to-customer conversion rates are more encouraging than top-of-funnel performance, with the majority converting at least 10% of leads into customers. Still, there’s a wide spread, and the meaningful share converting 30%+ shows just how impactful strong qualification, sales process, or product-led motion can be once leads are in the door.
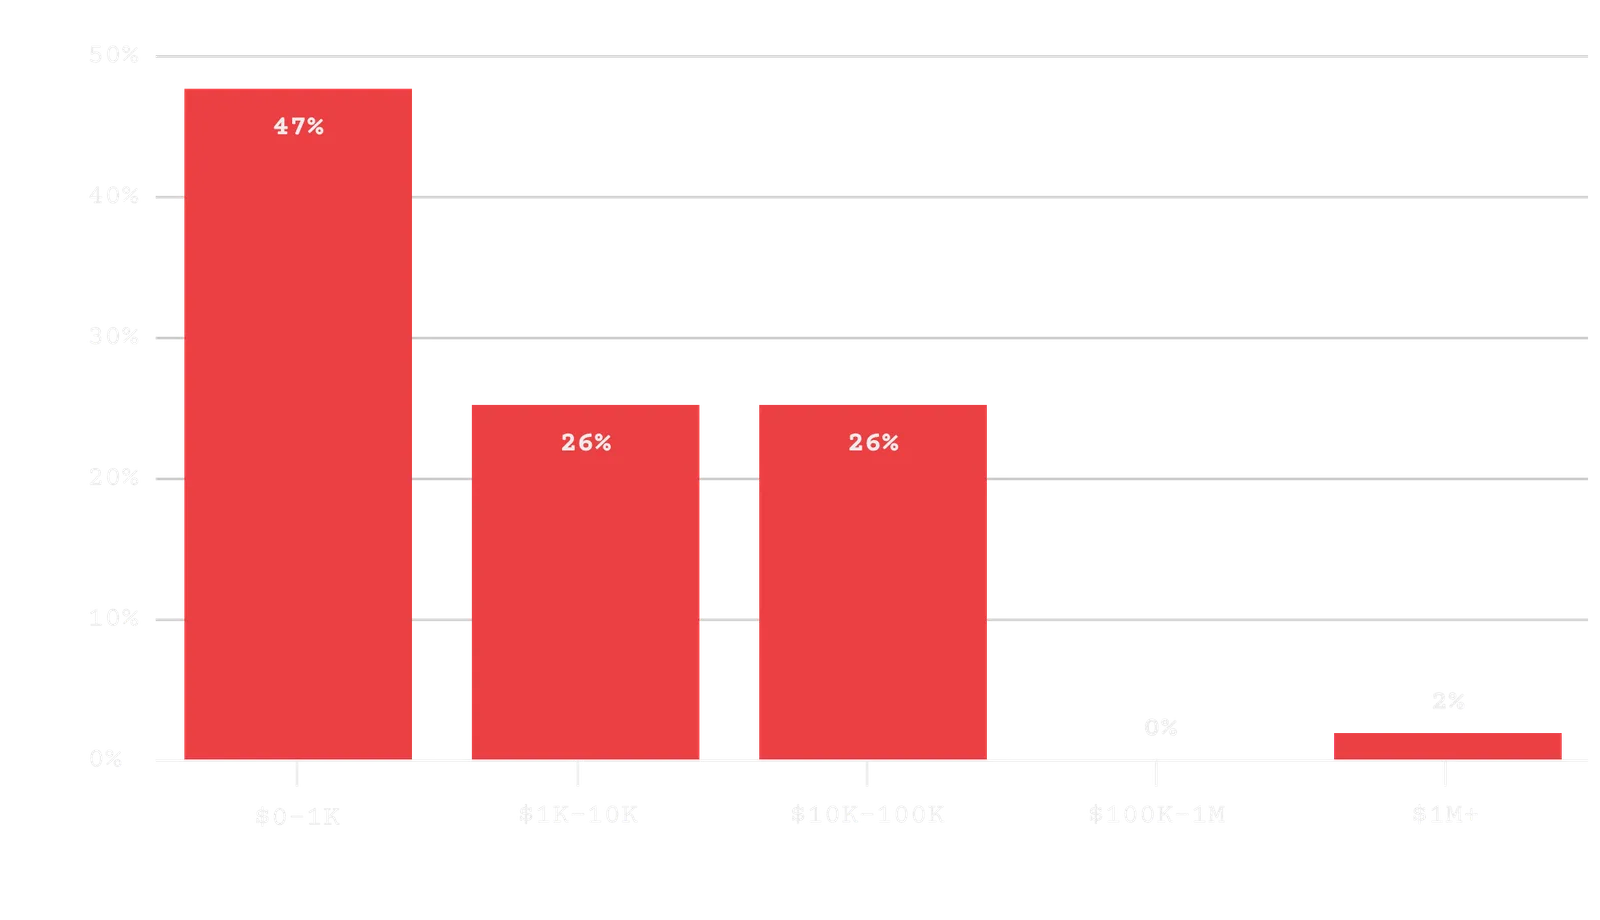
Which best describes your annual spending on marketing tools?
Nearly half of respondents are spending under $1,000 per year on marketing tools, reinforcing just how lean most stacks still are. At the same time, roughly half are investing more meaningfully, with a sizable portion spending between $1k–$100k annually, showing a clear split between scrappy setups and more scaled marketing operations.
0
4
Revenue and Pricing
Which best describes your monthly Average Revenue Per Customer?
ARPC is heavily concentrated at the lower end, with nearly all respondents falling under $1,000 per customer per month. This aligns closely with the dominance of small and mid-sized business targets, while also reflecting the makeup of this survey sample rather than the full spectrum of SaaS pricing models in the broader market.
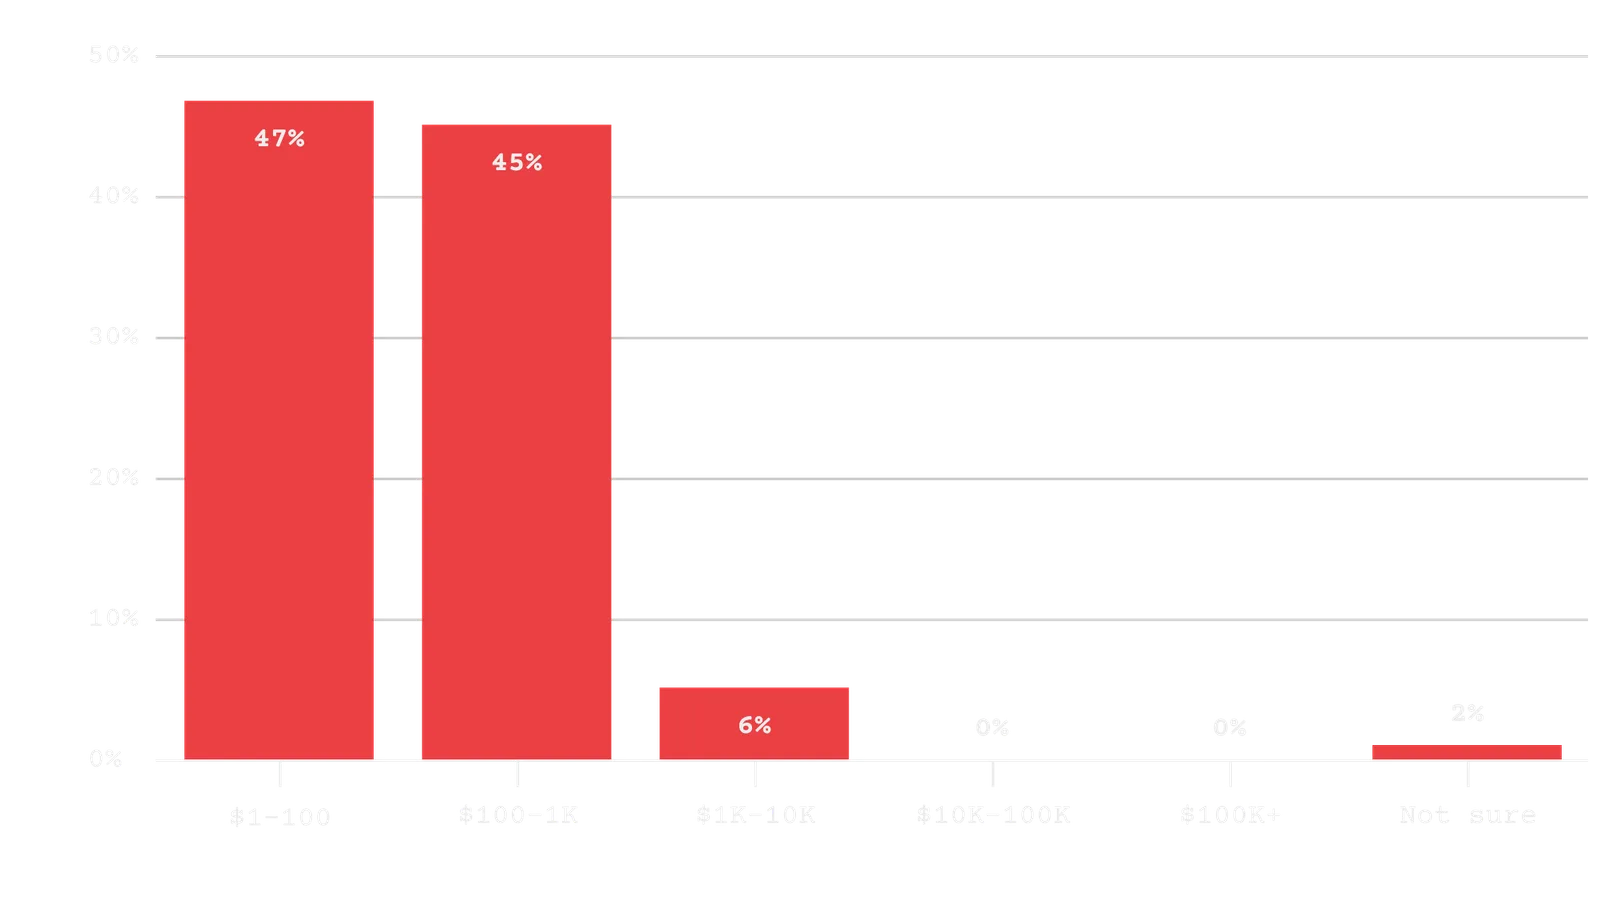
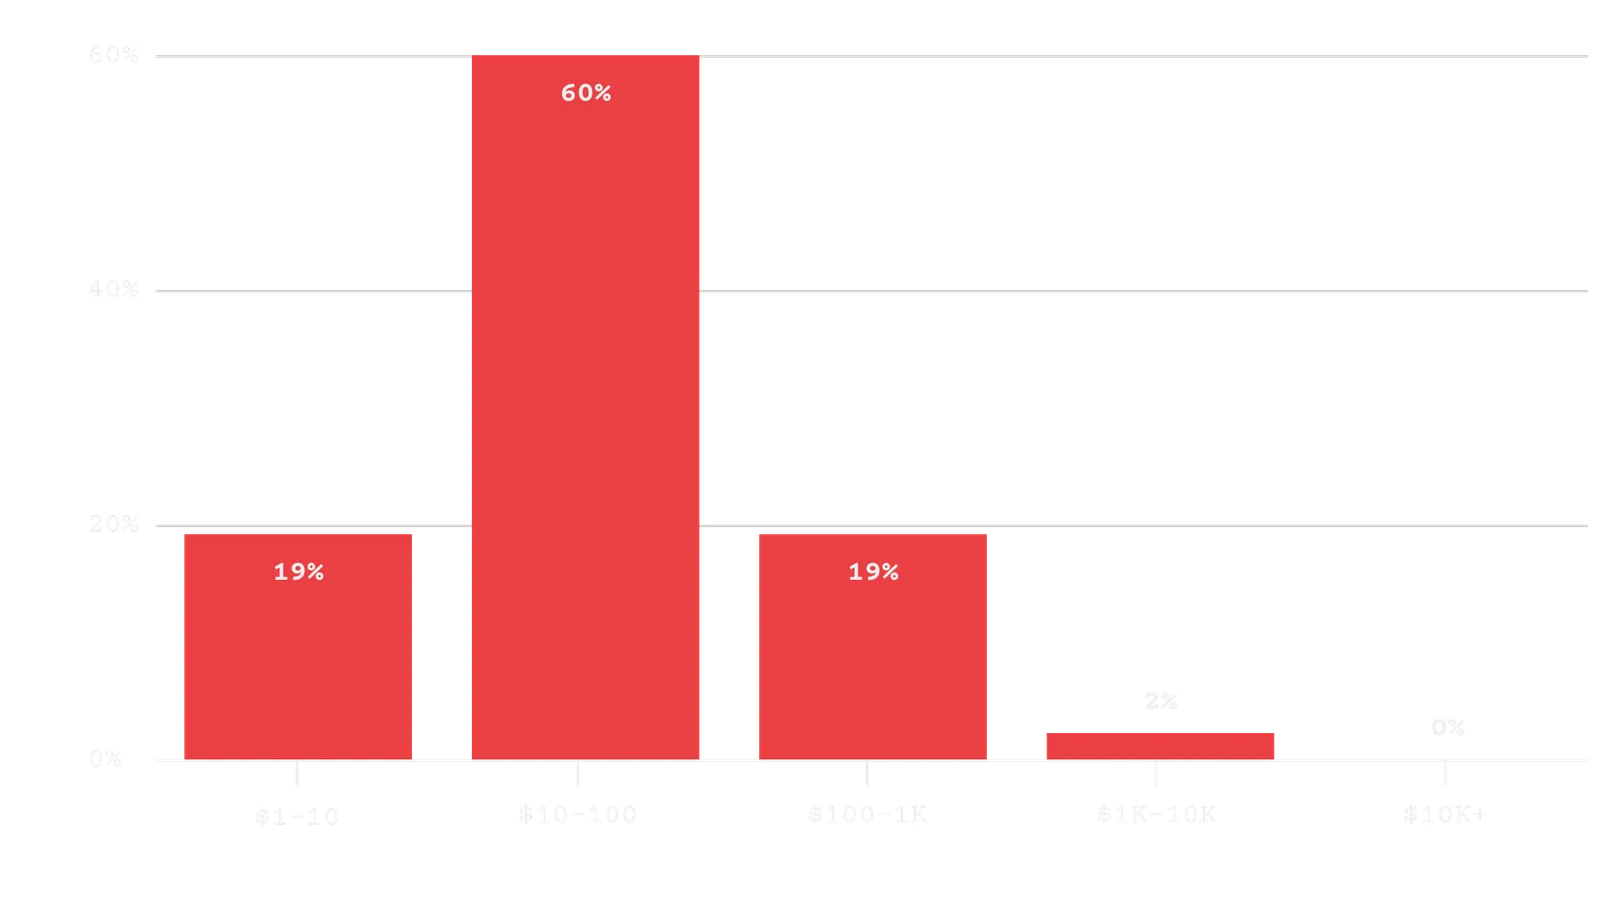
Which best describes the pricing plan for your lowest-cost pricing tier on a monthly basis?
The $10–$100 range overwhelmingly dominates as the most common entry-level price point. With a meaningful share starting above $100, this suggests many SaaS companies are intentionally anchoring on accessible pricing while leaving room to expand customers up the pricing ladder over time.
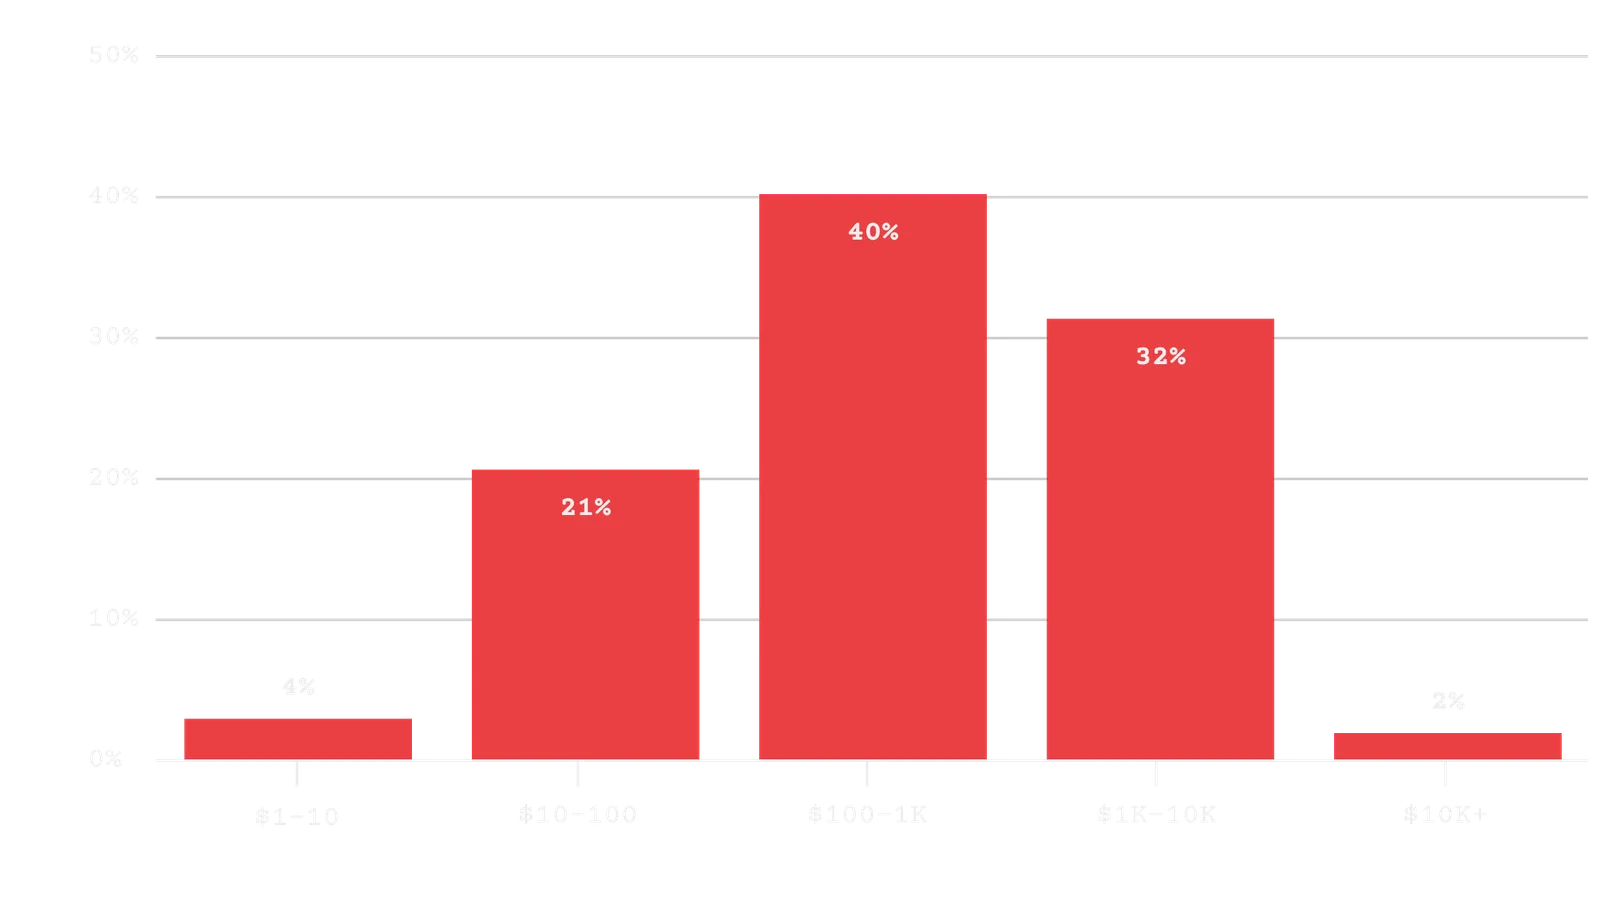
Which best describes the pricing plan for your highest-cost pricing tier on a monthly basis?
While most companies start with relatively affordable entry pricing, the top end of pricing tells a different story. A majority offer plans at $100+ per month, with nearly a third extending into the $1,000–$10,000 range, highlighting how common it is for SaaS businesses to support meaningful expansion revenue at the high end.
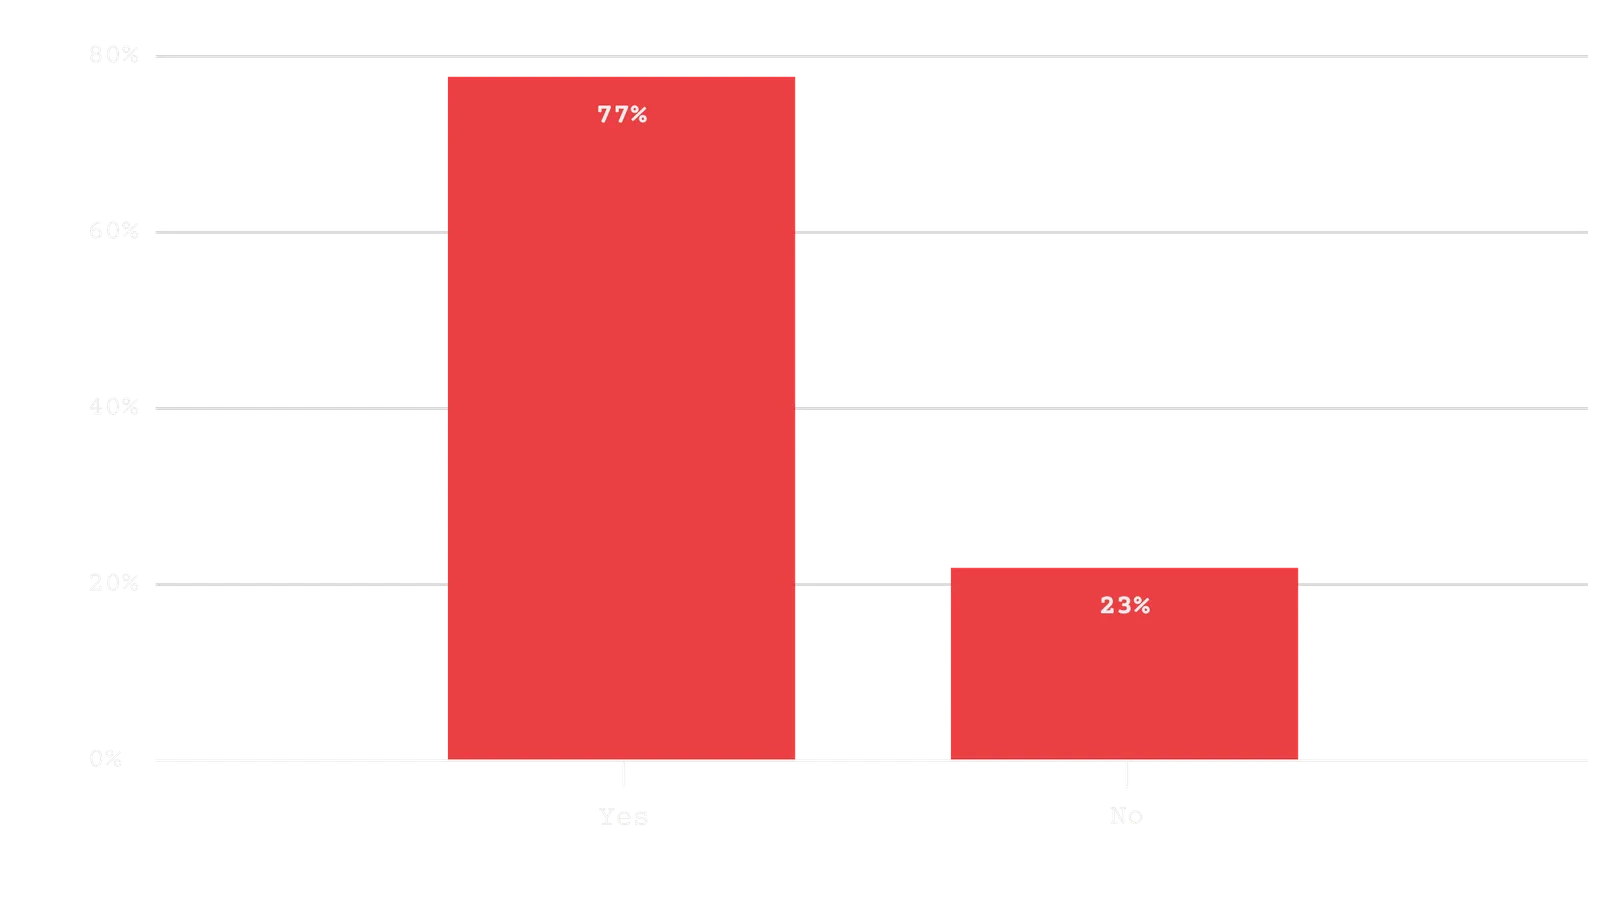
Do you offer a free trial for your product?
Free trials are clearly the norm, with more than three-quarters of respondents offering one. This reinforces how important “try before you buy” has become in SaaS, especially as competition increases and buyers expect hands-on product experience before committing.
Do you offer a forever-free plan?
Forever-free plans remain the exception rather than the rule. While a meaningful minority offer one, most SaaS companies still prefer time-boxed trials over free tiers, likely to keep acquisition costs in check and avoid supporting large volumes of non-paying users.
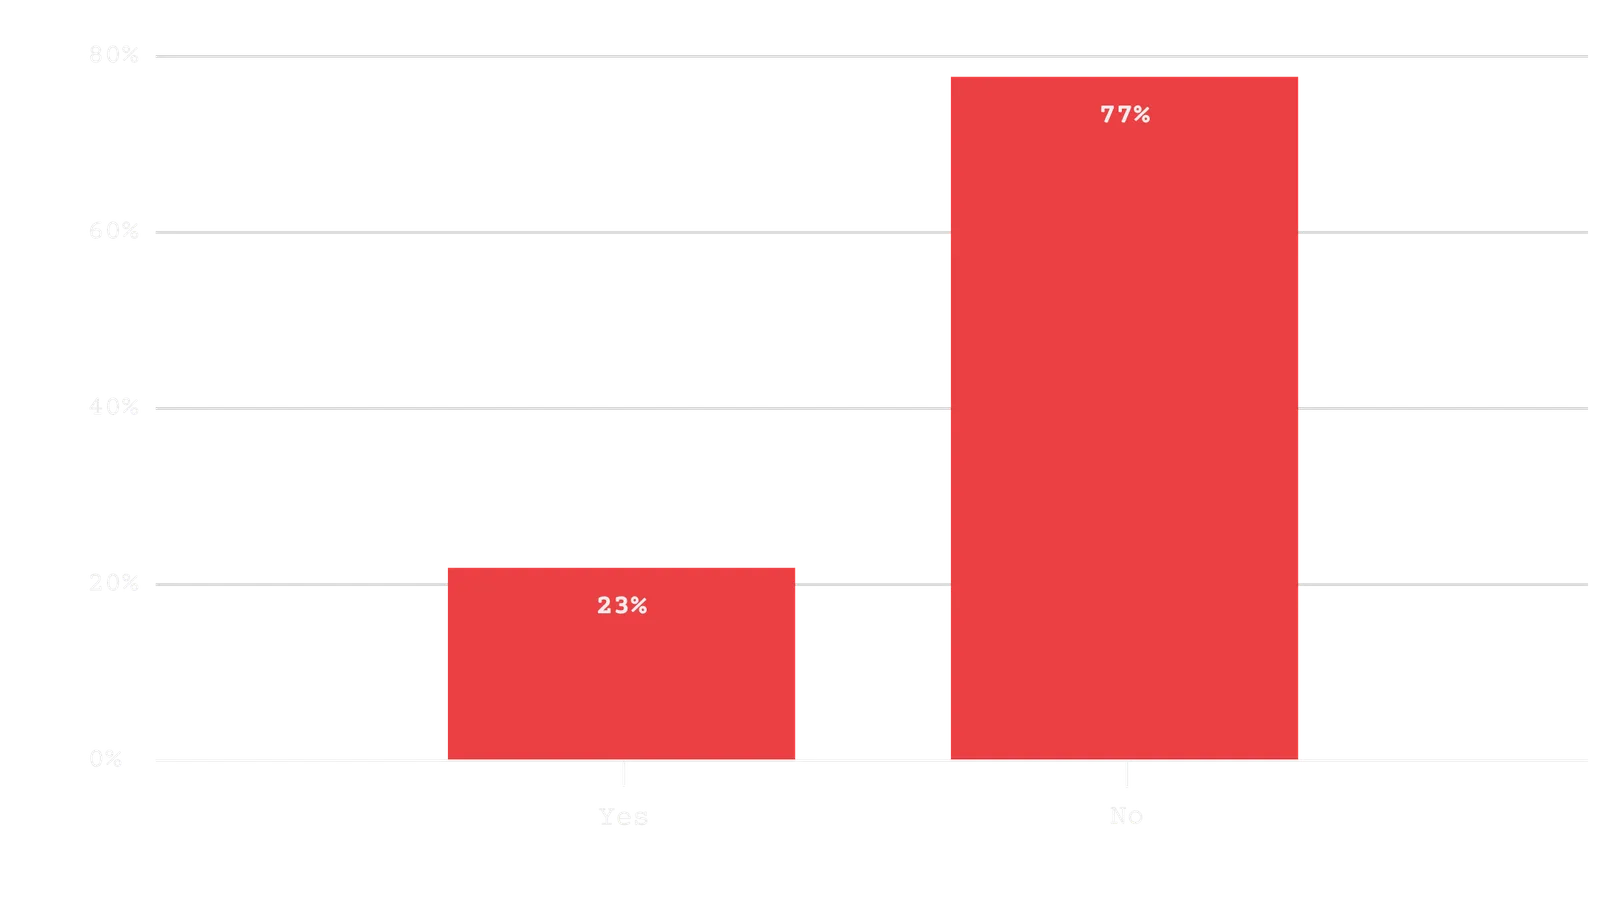
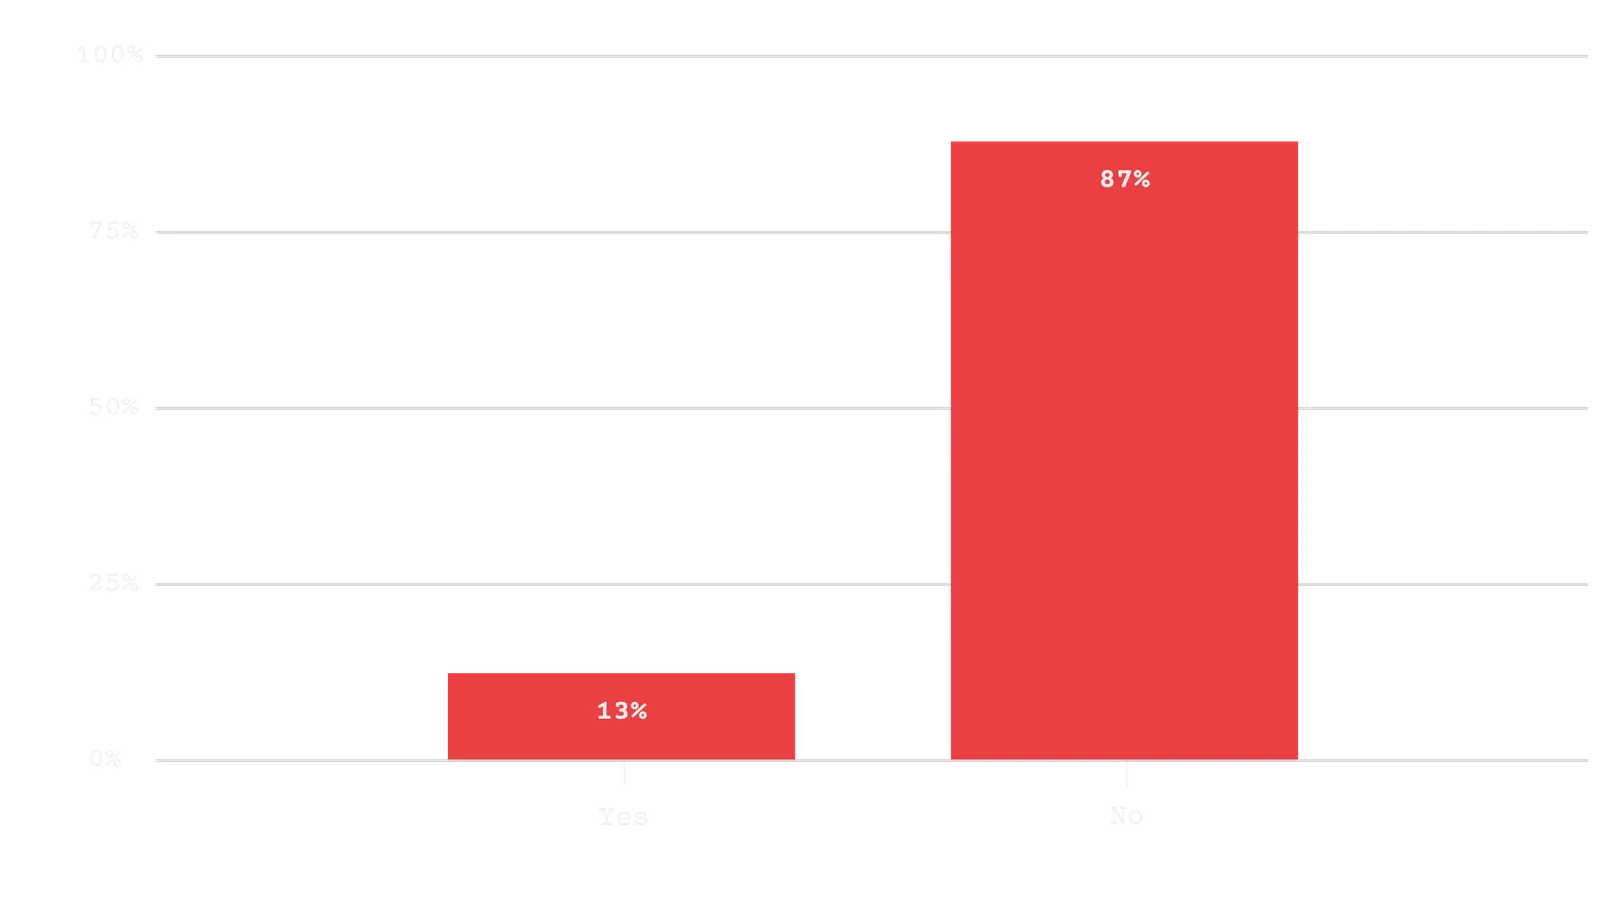
Do you charge a setup fee?
Setup fees are still uncommon, with the vast majority of companies choosing not to charge one. For the small group that does, this likely reflects higher-touch onboarding or more service-heavy implementations rather than pure self-serve SaaS models.
0
5
Growth Metrics
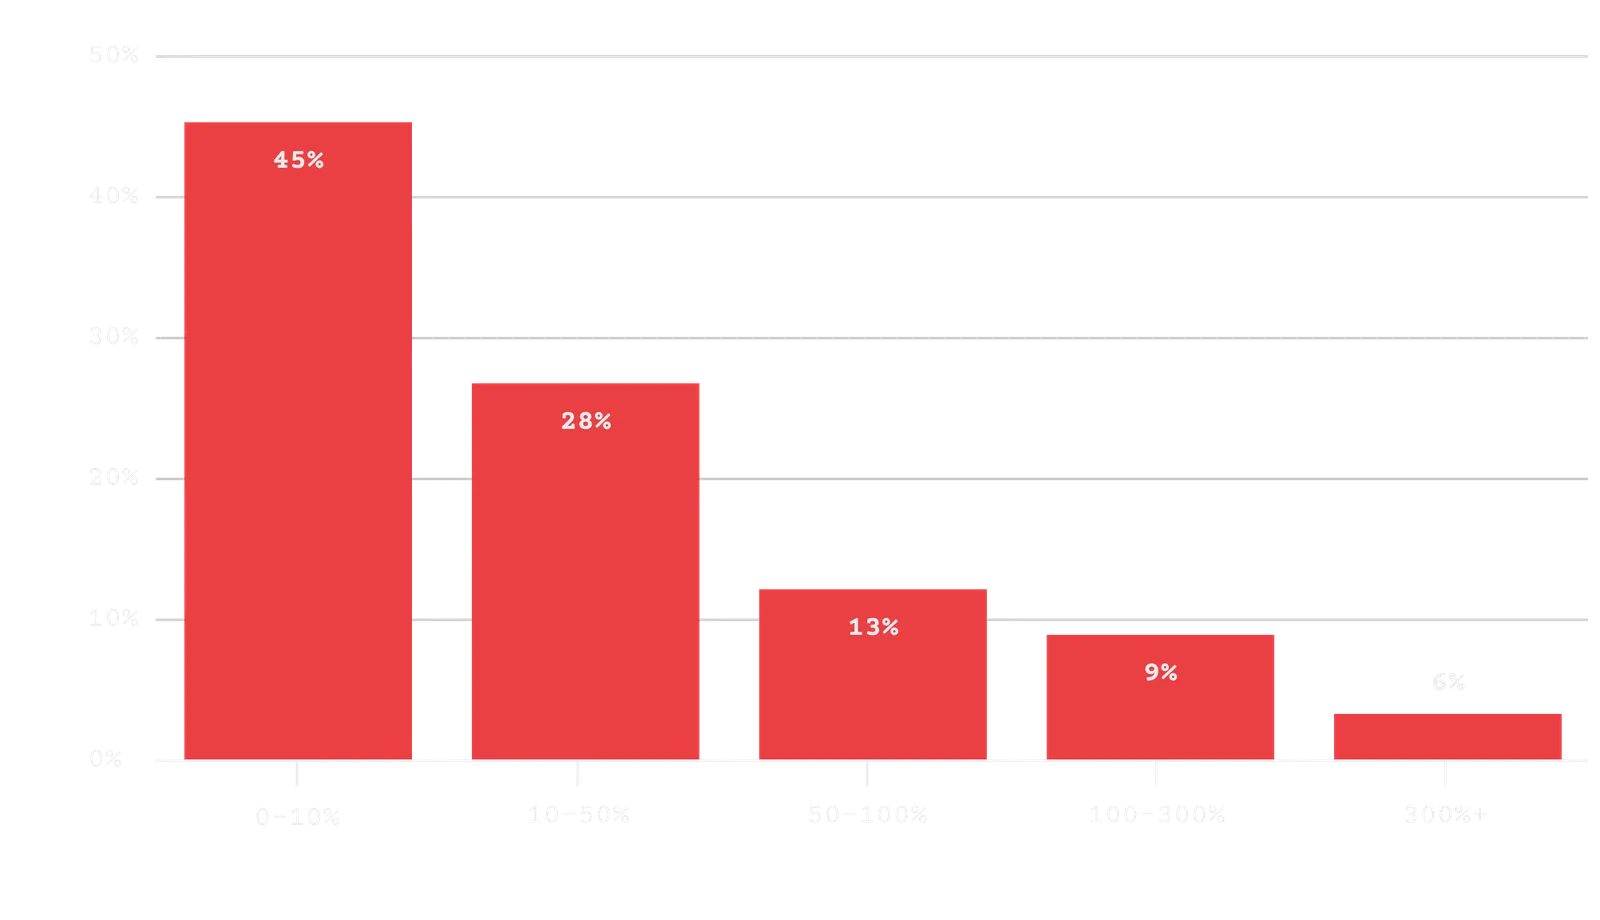
Which best describes your average year over year growth rate over the past 12 months?
Most companies are growing, but at a relatively modest pace, with nearly half reporting year-over-year growth under 10%. That said, a meaningful minority are seeing much faster momentum, with roughly one in four growing over 50% annually, highlighting the wide gap between steady, incremental growth and breakout performers in SaaS.
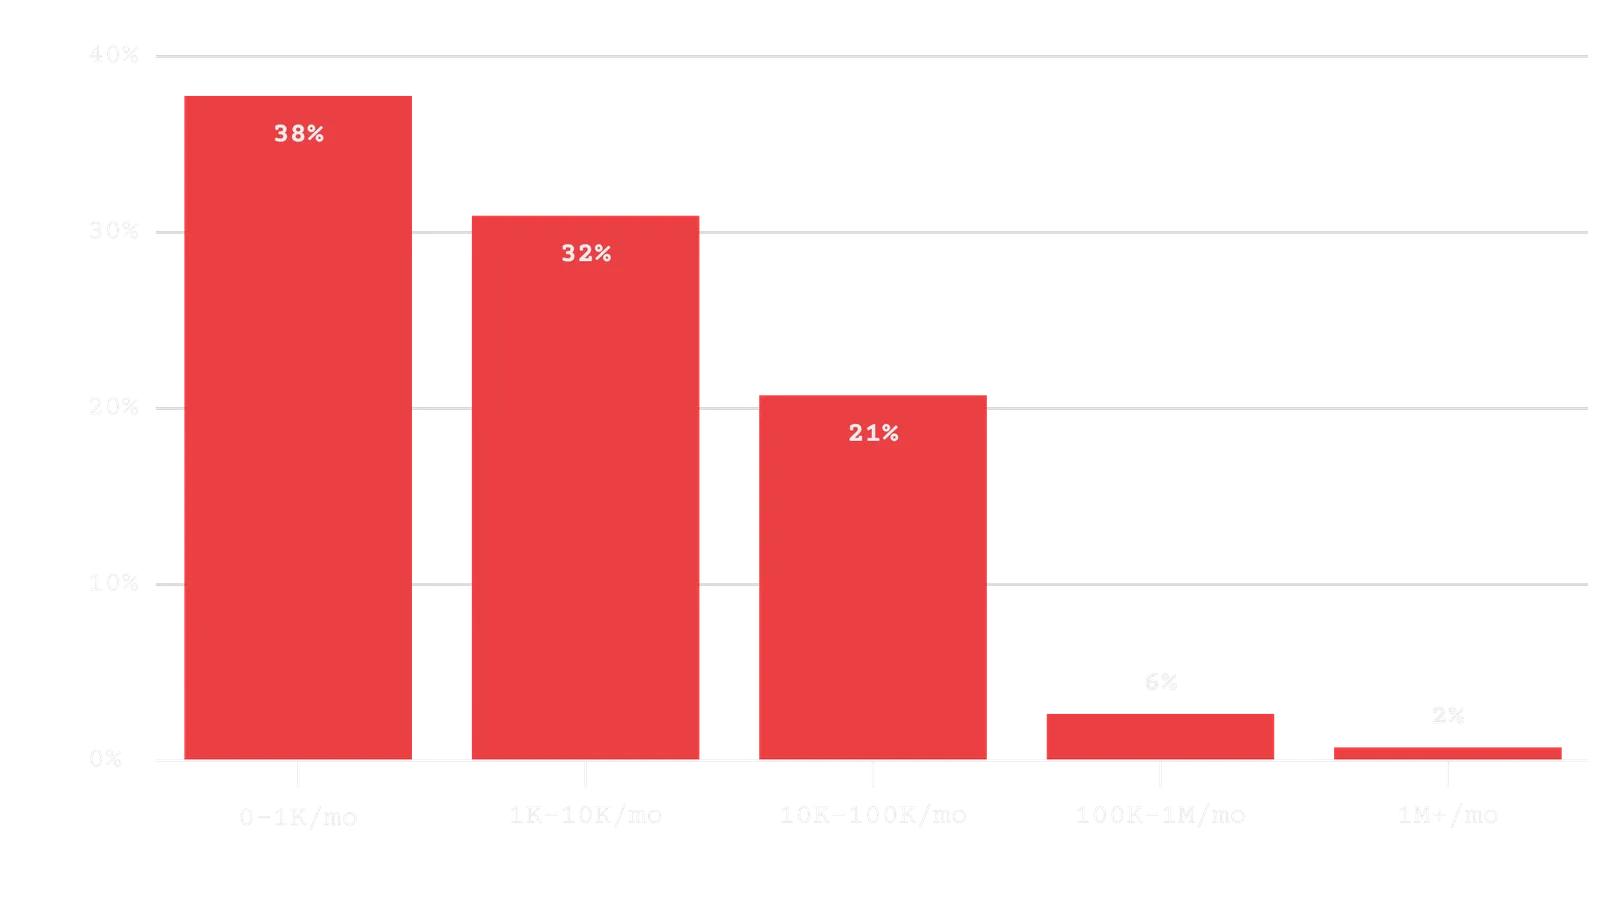
Which best describes your average website traffic of unique visitors over the past 3 months?
Website traffic skews heavily toward the lower end, with most companies seeing fewer than 10,000 monthly visitors. Higher-traffic sites do exist, but they’re the exception, reinforcing that for most B2B SaaS companies, growth is driven more by targeted, high-intent traffic than sheer volume.
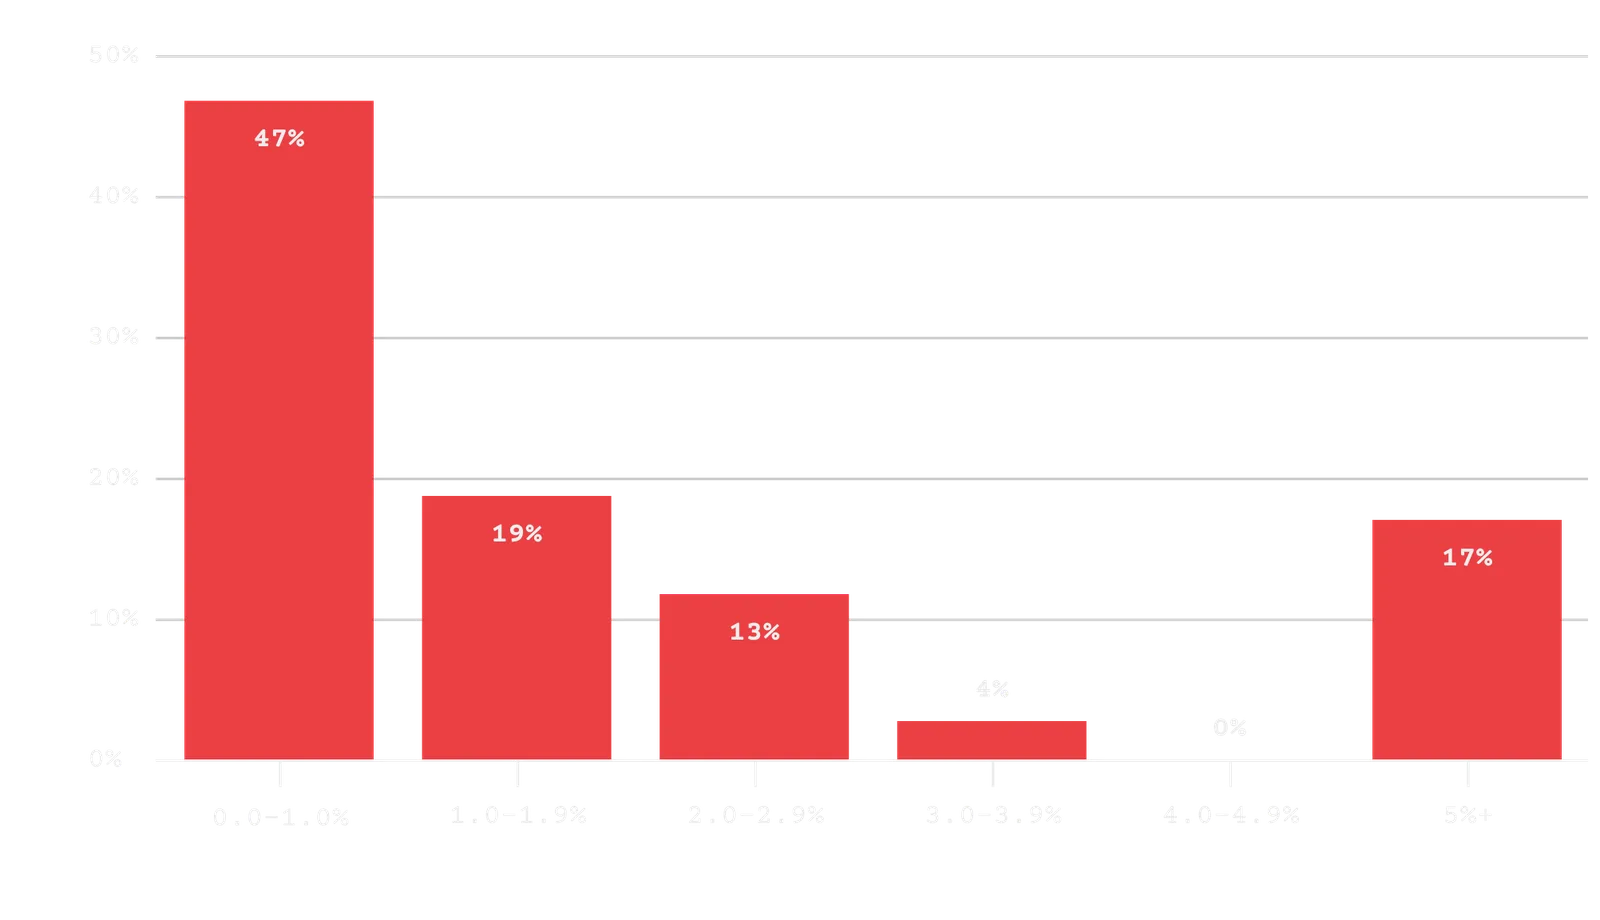
Which best describes your visitor to lead rate?
Most companies are converting a relatively small percentage of visitors into leads, with nearly half reporting conversion rates under 1%. That makes the 17% converting 5%+ particularly notable, highlighting a sharp divide between teams that have dialed in their conversion funnel and those still leaving significant upside on the table.
Which best describes your lead to customer rate?
Lead-to-customer conversion rates are more encouraging than top-of-funnel performance, with the majority converting at least 10% of leads into customers. Still, there’s a wide spread, and the meaningful share converting 30%+ shows just how impactful strong qualification, sales process, or product-led motion can be once leads are in the door.
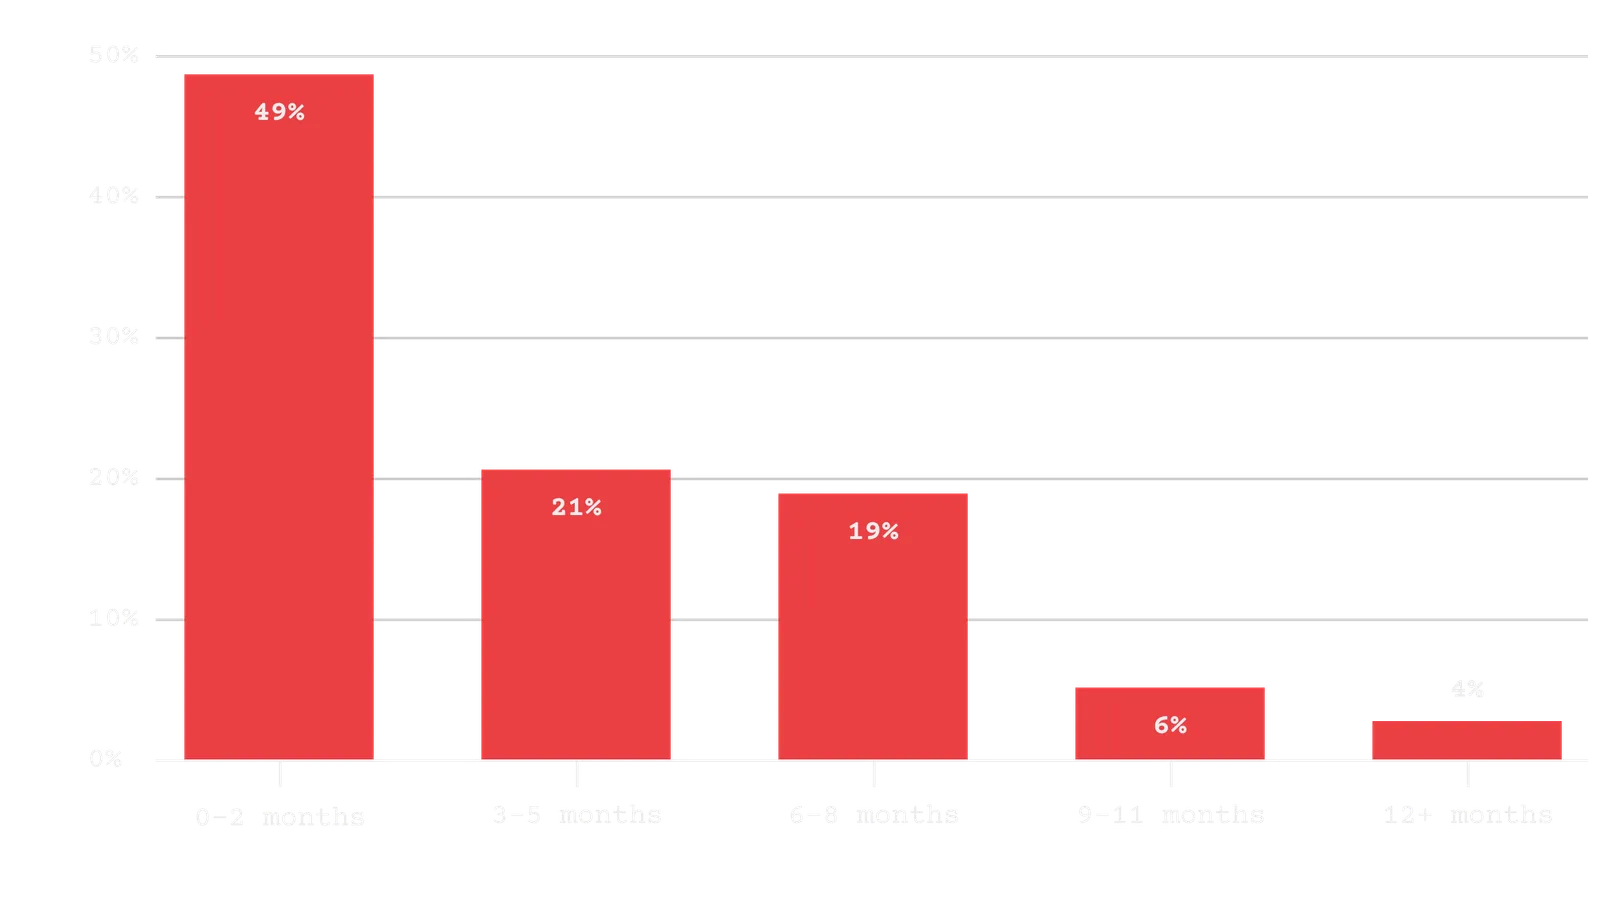
Which best describes your total blended payback period?
Payback periods are relatively short in this sample, with nearly half of respondents recouping acquisition costs within two months — likely driven by the prevalence of lower-priced, PLG-oriented products. Even when extending the window, most still fall under six months, suggesting efficient go-to-market motions for the companies represented here.
0
6
Marketing Channels
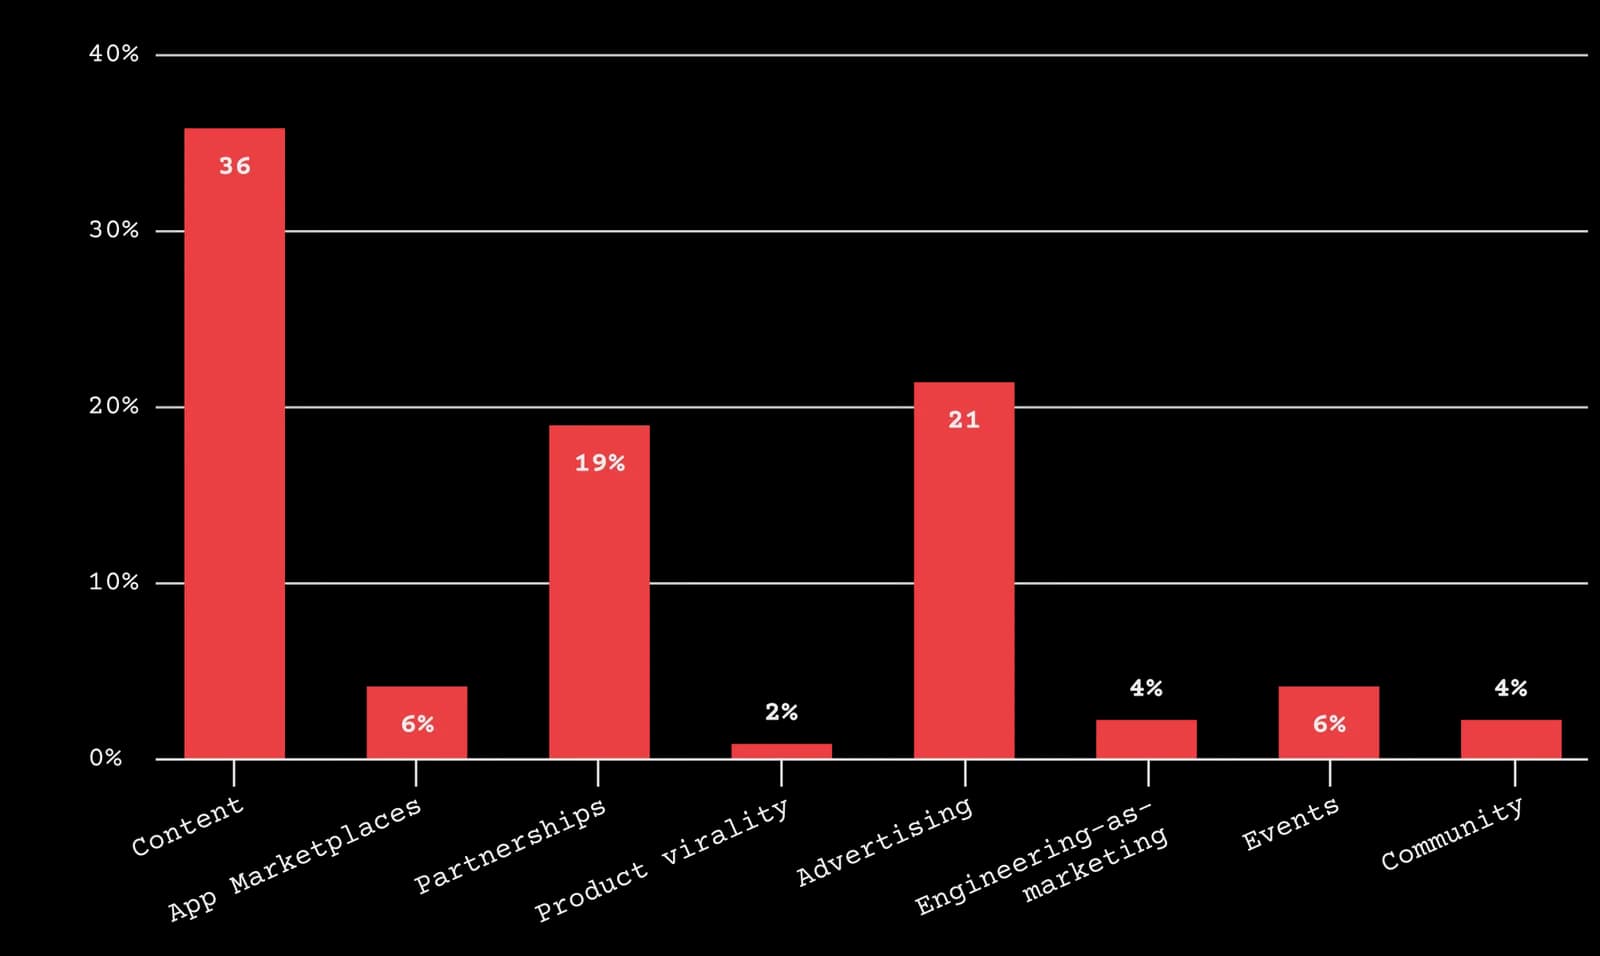
Which channel do you believe has the biggest impact on growing revenue?
Content continues to lead as the most impactful channel for driving revenue growth. That said, advertising and partnerships are close behind, while channels like engineering-as-marketing, events, and communities remain more specialized plays rather than primary growth drivers for most teams.
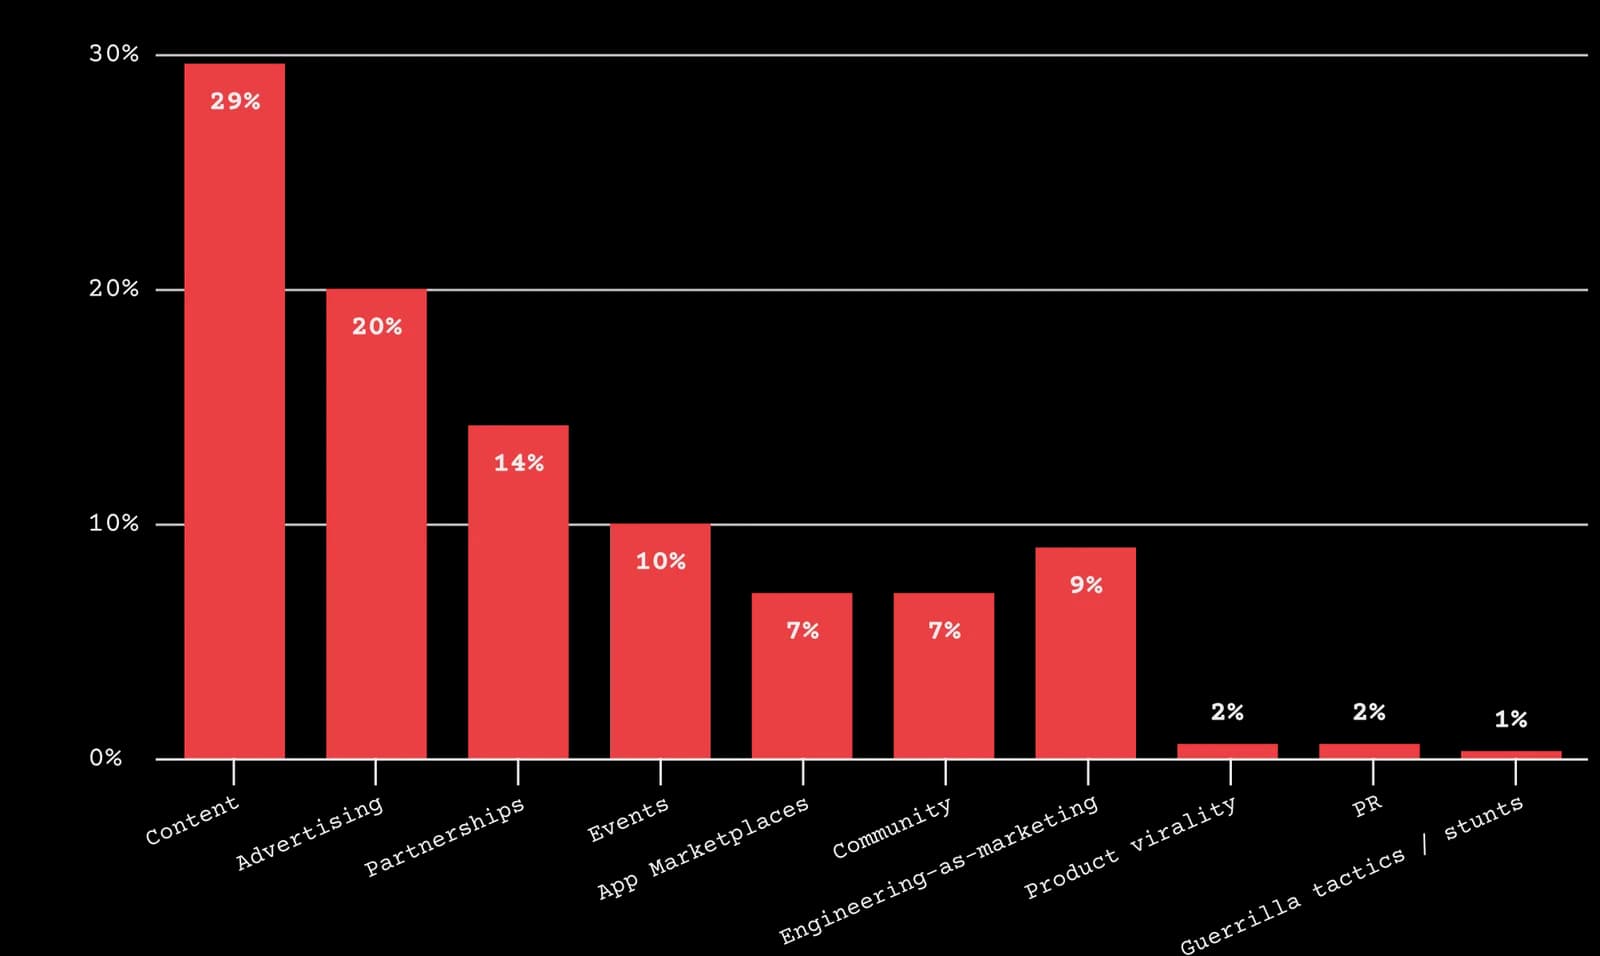
Which channels have you invested resources in the last 12 months?
Investment is spread more evenly across channels than impact rankings alone would suggest. While content still leads, advertising and partnerships have seen substantial investment, with teams also experimenting across events, marketplaces, and community, signaling a broader, more diversified approach to growth over the past year.
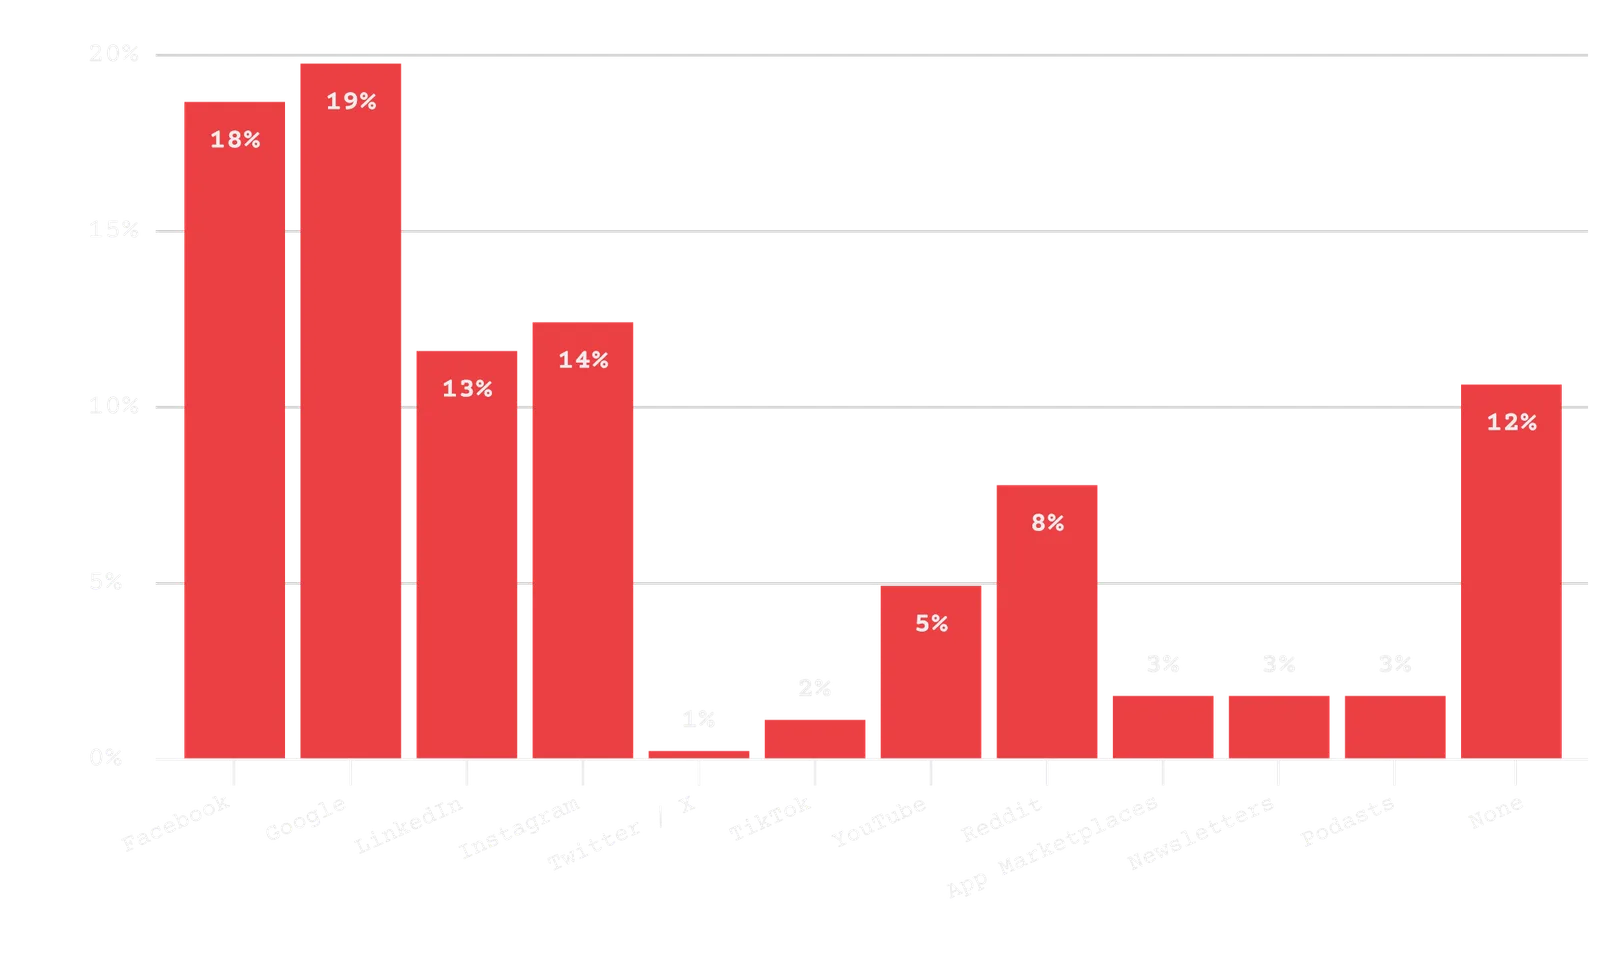
Which channels have your company advertised on in the last 12 months?
Paid spend is distributed across a wide mix of platforms, with Google, Facebook, Instagram, and LinkedIn leading the way. That said, a notable share report not advertising at all, reinforcing that many SaaS companies still rely primarily on organic or non-paid channels for growth.
Does your company send an email newsletter?
Email newsletters are now more common than not, with nearly two-thirds of companies sending one. This underscores email’s continued importance as a direct, owned channel for nurturing leads and customers without relying on algorithms or paid distribution.
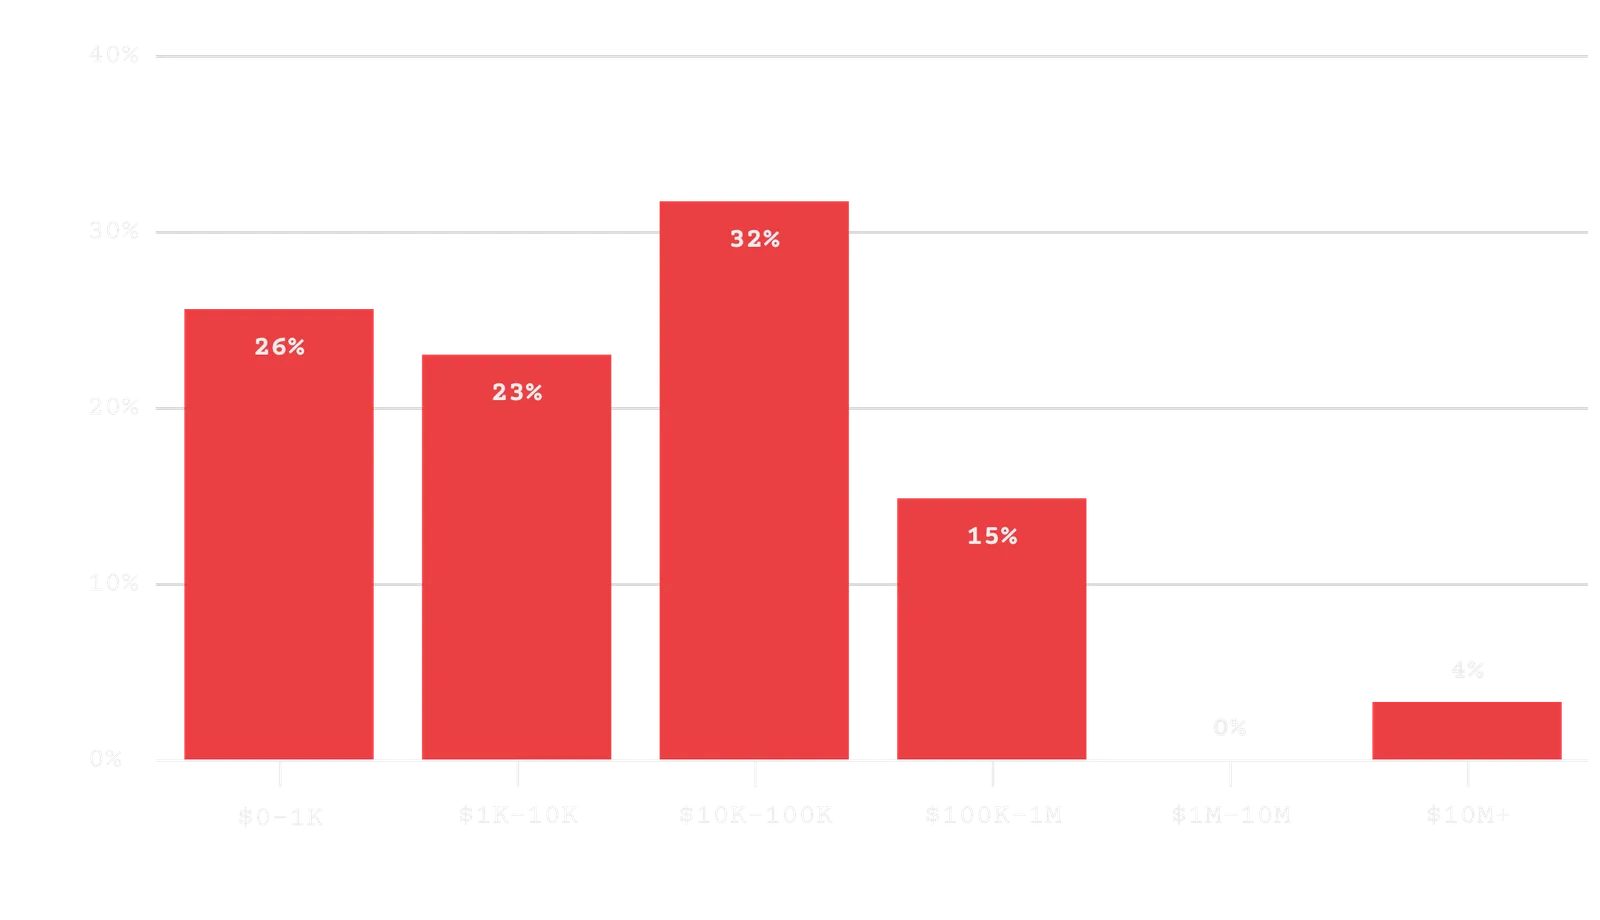
Which best describes how much money you have invested in marketing in the last 12 months, including salaries?
Marketing investment spans a wide range, but most companies are operating with relatively modest budgets. The largest share falls between $10k–$100k annually, with fewer teams investing at the high end, reflecting the lean, efficiency-focused approach that still defines most SaaS marketing orgs.
0
7
YoY Change Notes
SaaS Marketing in 2025: Leaner Teams, Sharper Focus, and a Shift Toward Sustainable Growth
Overall, the 2025 data paints a picture of SaaS marketing becoming more lean, deliberate, and efficiency-driven rather than simply growth-at-all-costs. Many of the core distributions look familiar, but the subtle shifts tell an important story about how teams are adapting to tighter budgets, more competition, and higher buyer expectations.
One of the most notable changes is how lean teams remain the default, even as companies mature. The “marketing team of one” is still dominant, with contractors filling in tactical gaps rather than companies making aggressive full-time hires. This is reinforced by modest tool stacks and relatively low annual tool spend, suggesting teams are prioritizing consolidation and ROI over experimentation with every new platform.
On the revenue and pricing side, the data continues to show a clear value ladder strategy. Entry-level pricing remains accessible, but the expansion potential at the high end is stronger than ever, with more companies offering meaningful $1k+ and even $10k+ plans. Rising costs for software services, especially with the ever-rising adoption of AI likely contribute to this. Combined with short payback periods, this suggests many teams are optimizing for sustainable growth by monetizing deeper usage rather than chasing volume alone.
From a growth and channel perspective, content still anchors most go-to-market motions, but investment has diversified. Advertising, partnerships, and events are absorbing more attention, while fewer teams rely on any single channel to do all the work. At the same time, conversion rates show a widening gap between teams that have dialed in their funnels and those still struggling at the top of the funnel, making efficiency and optimization increasingly decisive advantages.
Taken together, the biggest shift compared to 2024 isn’t a radical change in tactics—it’s a mindset change. SaaS marketing in 2025 appears more pragmatic, more selective, and more focused on doing fewer things better.
A thank you to just a few of our survey respondents



Swipe the best SaaS homepages
Grab our hand-picked collection of homepages proven to convert.